
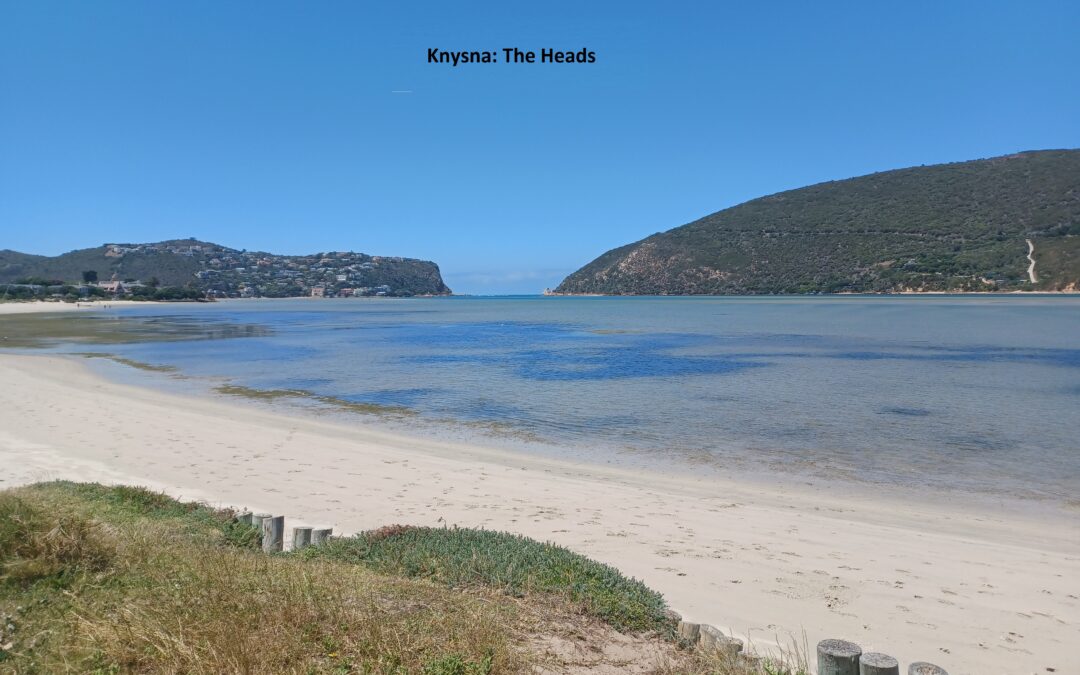
We recently made a holiday trip along the Cape coast starting in Knysna and ending up at the Weskus as far north as Velddrif. Amongst scientists who study climate change, there is much discussion about the increase in the level of the oceans and how this could affect life in and around coastal cities.
In fact, I heard some alarmists on radio claiming that by 2050 the water would rise to the level of Paarl. I decided to investigate. I show 3 graphs of places with sea level gauges on the western Cape coast.


We note an average increase of around 2 mm per annum for the western Cape. If we also include the results of the gauges on the east coast, the total average for South Africa is 1.75 mm/year. I must say that the error margin is large, on average 0.8 mm. I also suspect that at some stage new equipment was installed at most stations and that automatic recording procedures were instituted. This would make comparing current data with data from previous times somewhat complicated.
Be that as it may, let us assume that the graphs we have, thanks to NOAA, are completely correct and that we are dealing with a sea level rise of about 2 mm per annum, on average, for the western Cape. We can therefore expect a rise of 50 mm to bring us to 2050. That is 5 cm. To put this amount into some kind of perspective, I show you some pictures of the places that we visited, from top to bottom: Knysna, Brenton-on-Sea, Mossel Bay, Reebok, Jacob’s Bay, and Port Nolloth.


5 cm rise by 2050. Really? You have to laugh….
Yet, amongst our learned friends who study all the data from all over the world, which are all here:
https://tidesandcurrents.noaa.gov/sltrends/sltrends_global.htm
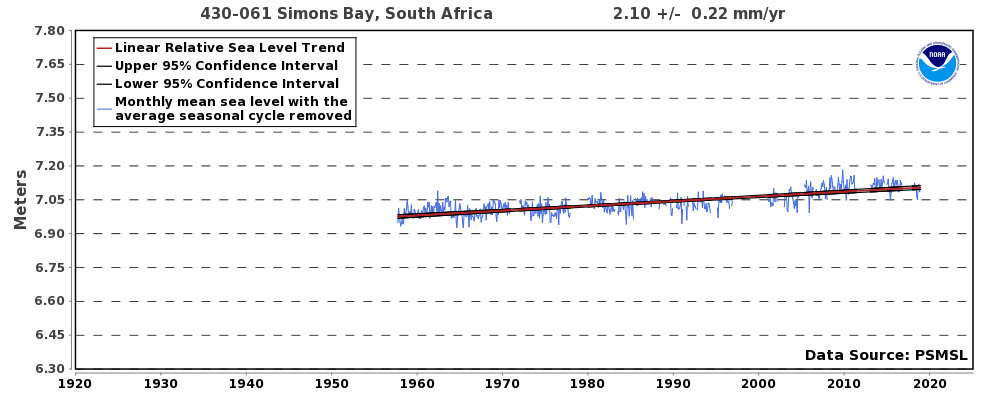
there are those who are arguing that there is an accelerating trend, meaning there is not only an upwards linear trend line, there is a curved line going upwards. Now, if I look at the gauge of Simon’s Bay – which seems to be the most reliable record that we have here, with the smallest error – you can see that the opposite is true: there is a distinct downturn from ca. 2015. To quote one of my friends over at the Dutch blog:
People who claim that all those hundreds of dead straight NOAA sea level lines worldwide (covering almost 200 years) are curves, are not scientists. I thought that such people were extinct after the Dark Ages, but they still appear to be present in large numbers. Insane.
Bravo Henry!
It’s simply too silly to talk about Henry.Den Helder, Cuxhaven and hundreds of stations worldwide show almost 200 years of slight sea level rise via dead straight lines with of course small variations up and down. The great thing is that the vertical movement of the land, which is included in all those graphs, is also in the vast majority of cases such a robust process (of thousands of years) and also straightforward. The few exceptions to this have already been indicated by Voortman and De Vos. What we see hundreds of times in the NOAA graphs is therefore always the sum of those two straight lines. Calculating a worldwide average from this is therefore of course nonsense, because the movement of the land differs per location and there are also, due to land rise, straight lines, between those (sometimes even very sharp) valleys, such as those of Skagway, Churchill, Oulu, Juneau, Kodiak, Stockholm, Oslo etc. etc.
Also think of this important article from 1978(!):
https://www.sciencedirect.com/science/article/abs/pii/0033589478900339
I have a pdf of this article in my possession. I believe that it is no longer available for free online.
Quote:”The close agreement of these predictions with the data suggests that, contrary to the beliefs of many, no net change in ocean volume has occurred during the past 5000 years.”
This would mean that almost all observed changes in sea level worldwide are the result of vertical land and seafloor movement(!). A fascinating thought that is not easy to prove, however.
we shall continue telling the truth
Dutch website link is here
(The quote at end of my post was from Chris Oldenhof)
https://www.climategate.nl/2025/12/de-stijging-van-de-zeespiegel-als-gevolg-van-de-opwarming-van-de-aarde-in-het-juiste-perspectief-plaatsen/
Over at the Dutch website we had a discussion about this report:
https://www.nature.com/articles/s41598-025-89258-9
which seemed to register a higher rate of increase in South Africa than the 2 mm per year reported by NOAA.
I explained that the law of communicating vessels (Pascal) dictates that the water level increase must be more or less the same everywhere on earth. Off the Californian coast, I note that it is also almost 2 mm/year, as it is also in Reykjavik (Iceland) and Le Havre (France).
We conclude that the world average for the water level increase must be around 2 mm per annum.
In places that deviate from the average, like NY (3 mm/yr) and Copenhagen (0.6 mm/year) there are valid reasons for the deviation (land is sinking or veering up)
Possible reasons for the anomaly of the satellite’s measurement:
1) faulty calibration
2) wrong time period chosen:
Note that the sea level increase appears to agree with a sine wave function, as apparent from the results form Den Helder in the Netherlands:
https://tidesandcurrents.noaa.gov/sltrends/sltrends_station.shtml?id=150-031
measurements by sat were only started in 1992.
Obviously, the wavelength of that function may differ from place to place.