
If you are interested in the subject of global warming, you should take some time to watch this interview of a renowned and experienced climate expert.
We all know that in the process of photo-synthesis, plants and trees need carbon-dioxide (CO2) in order to grow. What struck me were the things William Happer said about more CO2 in the air CAUSING more greening. To quote from the report that he referred to: ‘Increased levels of carbon dioxide (CO2) have helped boost green foliage across the world’s arid regions over the past 30 years through a process called CO2 fertilisation, according to CSIRO research.
In findings based on satellite observations, CSIRO, in collaboration with the Australian National University (ANU), found that this CO2 fertilisation correlated with an 11 per cent increase in foliage cover from 1982-2010 across parts of the arid areas studied in Australia, North America, the Middle East and Africa, according to CSIRO research scientist, Dr Randall Donohue.’
Source: Deserts ‘greening’ from rising CO2 – CSIROpedia
Professor Happer notes that if plants receive more CO2 from the air, they become more resilient and can survive with less water. Hence, the observed greening of the desert areas. It seems CO2 is our dung in the air: “more CO2? Yes, please!”
In a more recent study it appears that some of the extra greening of earth is also linked to human activities….:
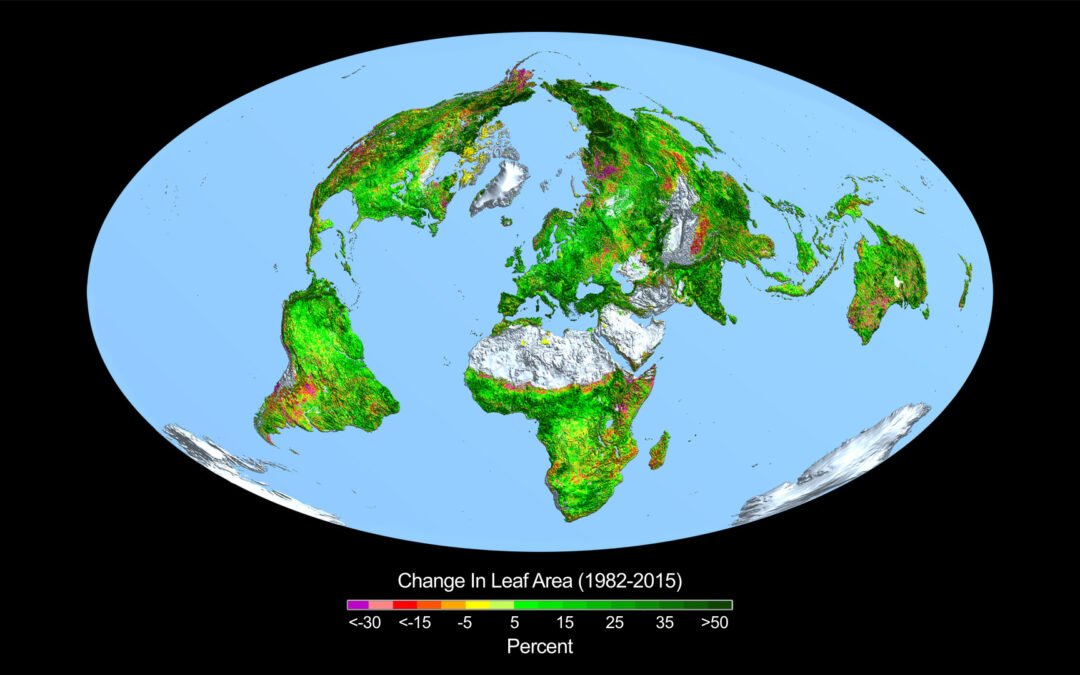
‘Taken all together, the greening of the planet over the last two decades represents an increase in leaf area on plants and trees equivalent to the area covered by all the Amazon rainforests. There are now more than two million square miles of extra green leaf area per year, compared to the early 2000s – a 5% increase.’
“China and India account for one-third of the greening, but contain only 9% of the planet’s land area covered in vegetation – a surprising finding, considering the general notion of land degradation in populous countries from overexploitation,” said Chi Chen of the Department of Earth and Environment at Boston University, in Massachusetts, and lead author of the study.”
Ja. Ja. Sure. We all want more lawns and more trees in our towns and in our own backyards. Planting of trees is what we now teach all our children, to absorb our CO2 emissions. This is happening everywhere in the world now. That is not a bad thing. Also, for more people to live, we need bigger crops….Nothing wrong with all of that! But what does all of this extra greening do to local temperature? A first indication came to me from reading a report from John Christy, published in 2006. I show the conclusion of the report:
‘Our results indicate that the central San Joaquin Valley has experienced a significant rise of minimum temperatures (∼3°C in JJA and SON), a rise that is not detectable in the adjacent Sierra Nevada. Our working hypothesis is that the rapid valley warming is caused by the massive growth in irrigated agriculture. Such human engineering of the environment has changed a high-albedo desert into a darker, moister, vegetated plain, thus altering the surface energy balance in a way we suggest has created the results found in this study.’
During my statistical analysis of 54 weather stations back in 2015, see Table 1, An Inconvenient Truth | Bread on the water, I came across 2 weather stations with somewhat puzzling results. In statistics, we call these results ‘outliers’. In the case of Las Vegas (USA), I found the minimum temperature rising by 5 degrees C since 45 years ago, pushing up the average temperature by almost 3 degrees C. In the case of Tandil (ARG) we find the minimum temperature decreasing by 2.2 C over same period, dragging the average temperature also down by almost 2 degrees C.
For more details, see here:
https://documentcloud.adobe.com/link/track?uri=urn:aaid:scds:US:79f6de4b-11f6-40e0-b1a0-2981363ef005
Now, as we know, 50 years ago, Las Vegas was a desert. There was no running water. Water was brought in from afar and gradually the desert was changed and developed for human habitation. Sure, some of the warming noticed in Las Vegas may be due to an urban heat effect as many skyscrapers were also built. But most probably not all of it. I am sure the change of the desert area into a big green oasis had something to do with it. (1)
In contrast, it appears that in Tandil many forest trees were chopped for logging or to make way for agricultural – and housing developments. A loss of about 10-15% in leaf area is apparent (see picture, area is orange). (2)
Looking again at my own results for South-Africa, I find that Johannesburg is about the only place here that shows some significant warming over the past 40 years. Here too, there was no running water or river. It used to be a savannah area. But there was gold….(3)
Note again the picture at the beginning of this post. Do you see that the leaf areas around the arctic seas all appear to have increased by more than 50%? Remember that it was here that we found most of the warming taking place? See: An Inconvenient Truth | Bread on the water (4). We were also aware of the difference in the warming of earth where there is more land (5), i.e. in the NH, see: Wood for Trees: Interactive Graphs
In his latest report on Climate Change in Alabama, John Christy wrote:
‘Every trend calculation starting from 1895 through 2010 and ending in 2020 produces more warming in the lows than the highs’.
Which is exactly what we would expect if the trend of greening in Alabama is increasing. Indeed: It is up about 10% from 1982 (if my chart at the top of this post is correct). (6)
These 6 observations all support the argument that the extra greening [of earth] is causing some extra heat entrapment.
Please feel free to use any or all the information given in this post for your own blog or project. However, if you do, it would be nice if you would consider making a donation to our charity, Heart for Children. We raise funds for orphans and abandoned children.
For more information, see here: https://heartforchildren.co.za/
Found the article from your
comment on a climate science
website — i forgot which one.
“Borrowed” it for my own
climate science and energy blog
with a recommendation for
your blog and a link.
https://elonionbloggle.blogspot.com/2022/01/global-greening-by-henry-pool.html
I substituted a newer greening chart.
I’ve had over 279.000 page views so far,
and got about 200 more visits yesterday.
Hopefully, manyreaders will sample
your blog.
Concerning the San Joaquin Valley:
Both CO2 and water vapor are greenhouse
gases so increasing them
will cause some nighttime
(TMIN) warming.
Irrigation has increased
water vapor in the atmosphere
along with the warming since 1975
but global WV measurements
are difficult.
Richard Greene
Bingham Farms, Michigan
Keep up the good work !
I placed a slightly revised version of your article
on my climate science and energy blog today.
https://elonionbloggle.blogspot.com/2022/01/global-greening-by-henry-pool.html
It is really advisable to see the whole lecture of William Happer when he was in Holland – it is in English (with subtitles in Dutch) see here:
https://youtu.be/PblYr-KjOVY
I originally published your article
with three links to your blog and the article.
i wrote you an e-Mail
but your blog address would not load
and I’m shocked that it reached you.
Then i checked to see that the links
to your blog worked and they did not work,
I could not load your website.
So I immediately revised the article on my blog
by deleting two of three links.
Today the link was working properly. so i republished
my original version of your article today — something
I have never done before.
Now including all three links, and my recommendation
to view the Happer video at your blog..
Glad I saved the original version.
Some people call them computers
I call them “confusers”
No need to publish this information
in your comments. I’m still surprised
my original comments got through, because
my screen locked up when I tried to send them.
Weekends are slow here –but there should be about
200 viewers here today. There were 228 yesterday,
but I suppose the link to your blog also didn’t
work for them?
https://elonionbloggle.blogspot.com/2022/01/global-greening-by-henry-pool_16.html
Richard Greene
Arjan asked me (on the Dutch blog)
Henry, can you quantify the warming due to greening?
Henry says:
Arjan, you hit the hammer on the nail. I also first thought that it might not be significant.
Here is the abstract from John Christy’s report of 2006:
The debiased segments are then merged, forming a complete regional time series. Time series of daily maximum and minimum temperatures for stations in the irrigated San Joaquin Valley (Valley) and nearby nonirrigated Sierra Nevada (Sierra) were generated for 1910–2003. Results show that twentieth-century Valley minimum temperatures are warming at a highly significant rate in all seasons, being greatest in summer and fall (> +0.25°C decade−1). The Valley trend of annual mean temperatures is +0.07° ± 0.07°C decade−1. Sierra summer and fall minimum temperatures appear to be cooling, but at a less significant rate, while the trend of annual mean Sierra temperatures is an unremarkable −0.02° ± 0.10°C decade−1. A working hypothesis is that the relative positive trends in Valley minus Sierra minima (>0.4°C decade−1 for summer and fall) are related to the altered surface environment brought about by the growth of irrigated agriculture, essentially changing a high-albedo desert into a darker, moister, vegetated plain.
So they measured 0.07 C/decade, but in neighboring Sierra Nevada the temperature went down by 0.02C/ decade, due to natural causes. So the corrected result is 0.09K/decade.
Now look at my result in Las Vegas. This also used to be a desert. The average temperature went up by 0.65K per decade. That is about +3C over de last 50 years.
Johannesburg is one of the few places in South Africa where I observed some significant warming. Note that Johannesburg did not have any natural water. This used to be savannah. But there was gold. So they brought water. Here I measure + 0.18C per decennium.
Now let us look at the areas in the Arctic. If you look carefully on the chart at the beginning of this post you can see that the leaf area increased by more than 50% in the areas around the arctic ocean. It appears from current measurements that it is warming there by about 0.5K per decennium.
So:
0.09 + 0.65 + 0.18 +0.5 / 4 = 0.36K/decade.
This is 300% of the warming reported by Spencer &….. But obviously, we only looked at a few areas where it became a lot greener.
Amazing, is it not?
We have to consider cause and effect. Did earth get greener because it got warmer (rather than only more CO2)?
Thanks for this important article.
Plants decrease albedo – which warms.
But plants also increase humidity in their own vicinity, and result in more water in both atmosphere and soil. This will tend to cool.
But warming / cooling is not so relevant – plants definitely improve their environment.
This is almost a hollow circular statement since the abundance of plants itself is the criterion of the quality of the environment, in the sense of meadow or forest being better than desert.
Plants are good; CO2 is good!
Here are a couple of my articles on the subject:
https://ptolemy2.wordpress.com/2020/10/04/co2-fertilisation-and-the-greening-of-the-sahara/
https://ptolemy2.wordpress.com/2021/07/24/why-are-leaves-green/
Phil
I refer again to the abstract in the report from John Christy et al of 2006.
‘A working hypothesis is that the relative positive trends in Valley minus Sierra minima (>0.4°C decade−1 for summer and fall) are related to the altered surface environment brought about by the growth of irrigated agriculture, essentially changing a high-albedo desert into a darker, moister, vegetated plain.’
So, here it agrees with your statement, about the change in albedo and I agree with that also. But they also mention that minima are mostly affected during the time of most growth.
IMHO there is another reason for that. I remember from my biology class that there are two important reactions concerning plant life. The one takes place during the day, with the chlorophyll under the influence of UV. Apparently this reaction is endotherm. So, it consumes energy from warmth of the day.
The other reaction (with CO2) takes place during the night – this is when the sugars are made and growth takes place. In fact, this is where all our food and drinks come from.
I believe this reaction is exotherm: It produces heat!
I think it is the latter reaction that is also an important factor as it does most of the trapping of heat during the night.
So, the correct process is: More CO2 => enables more vegetation + humans do more planting => more global warming.
That’s interesting about the night part of photosynthesis (reduction of CO2 to sugars) being exotheric. I seem to remember reading that most “global warming” is increase in night temperatures. Could that be just more photosynthesis from CO2?
Remember they add up 1000ppm CO2 to the tomatoes greenhouses to get bigger 🍅. But it is during photosynthesis that heat is used and during the night the trees and plants grow and these processes are exotherm.
https://www.nature.com/articles/nclimate3004
Probably a tiny bit of higher nighttime temperatures due to urban heat effect on lots of data points/sensors.
I did some research on Alaska today. It seems from the chart picture at the beginning of this post that the leaf area decreased substantially here. In all three cases studied, namely Tanana, Anchorage and Kenai, I find that minima have virtually remained unchanged when looking at it from 1973. In the case of Anchorage it even went down a bit. Funny enough, in this area maxima went up which also pulled the average temperatures a bit up as well. You would therefore think that the case is undecided. However, the increase in maxima is most surely due to more sunny hours & less clouds and normally this would have pulled up the minima as well. If I quantify this, it is clear that minima actually went down due to the loss of leaf area.
These results from Alaska therefore do not contradict the results as reported in my post.
I also looked in Bursa, Turkey, which shows strong greening if I go by the chart.
As expected, I find that temperatures have gone up here, by 0.08 K/ year from 1973,
i.e. 3.8C warmer now then in 1973. Maxima here only went up by 0.04K/year. So clearly, it was minima that pushed up the average temperature; this is exactly the warming due to the increase in greening.
It seems to me that green areas heat up less during the day (plants absorb some of the sun’s radiation), while at night bare rocks radiate much more strongly into space.
In my opinion, the mechanism for the extra warming due to greening is partly as explained earlier in the quoted report i.e., a change in albedo. But I think there is also another reason. I do remember from my biology class that there are two important reactions concerning plant life. The one takes place during the day, with the chlorophyll under the influence of UV. Apparently, this reaction is endotherm. So, it consumes the energy from the warmth of the day. The other reaction (with CO2) takes place during the night – this is when the sugars are made, and growth takes place. Basically, this is where all our food and drinks come from. This reaction is exotherm: It produces heat! I think it is the latter reaction that is also an important factor as it explains the trapping of the heat during the night and in the growth seasons, as reported by Christy et al. 2006.
See also: https://breadonthewater.co.za/2022/03/08/who-or-what-turned-up-the-heat/
Parts of this article were also published on the Dutch blog:
https://www.climategate.nl/2023/05/vergroening-en-klimaat/
It’s hard to find experienced people on this topic, but you sound like you know what you’re talking about!
Thanks