

We are bombarded every day now by all of the media telling us that we have to be fearful of the global warming caused by the carbon dioxide (CO2) coming from the burning of fossil fuels. This little bit of extra CO2 is now blamed for each and every drought, every storm, every bad wind and every flood as if these things never ever happened before in the past…[1]
What is the extent of the problem?
The greenhouse effect (ghe) is due mostly to the presence of water and water vapor in the atmosphere and it is making earth about 33 degrees C warmer than it would be if there were no greenhouse gases. Thank God! Aren’t we lucky? Assuming the average temperature on earth is about 15 degrees C, can you imagine what life would be like if we all had to live at -18 (see picture). My own statistical work shows that the differences between the night temperature in a desert (no humidity) and near the equator (high humidity) is already 30 degrees; that is a few meters from the ground. Various reports indicate that the ghe really only plays out in the first 3 km of the atmosphere [2]. We know that the average amount of water vapor in the atmosphere from 0-3 km is at least 10000 ppmv, that is 1,0% v/v. [3]. Let us assume that the ghe of CO2 is just as strong as that of water vapor. I personally know that this is not so – see [4], [5], [6] and [7] – but for argument’s sake, let us say that it is true. The CO2 content in the air is currently around 410 ppmv, i.e. 0.04% v/v. Before 1850 it used to be 0.03% v/v and according to the various ice core analyses / proxies it has been rather constant at that percentage throughout the history of man. We can now do a simple calculation to determine the extent of ‘the problem’. First of all: what is the influence of CO2 on the total gh effect?
By me, it is simply 0,04/1,04 x 33K = 1.3 degrees C
(note that the percentages of other gh gases in the atmosphere are so small that it does not make a difference in this calculation. For example: methane is 1.8 ppmv, this is only 0.00018% v/v)
Most scientists agree that the maximum amount of CO2 that all of us put up in the air since 1850 was 100 ppmv CO2, i.e. 0.01% v/v (dCO2). Must say that that amount is debatable as it follows from normal analytical chemistry that warmer oceans also put out more CO2 due to outgassing: HCO3- + heat/UV => CO2(g) + OH-. In the final analysis, this reaction is the reason why a carbon-based life system could develop on earth……But never mind all that. Let us assume that all dCO2 came from man alone. Hence, secondly, we can now easily calculate the amount of warming that came into being because of more CO2:
dCO2/CO2 total x 1,3 = 0.01/0.04 x 1.3 = 0.3 degrees C.
Another method for calculation is shown in foot note [18]. A basic error that early climate scientists made is thinking that CO2 formed carbonic acid with water vapor whereas in fact it behaves like an ideal gas. Note that this 0,3 or 0,4K is really the maximum amount of heating that can be attributed to the extra CO2 that humankind has brought into the air. In fact, according to some scientists like me, it is probably less.
What about the add-on effects?
Yes. There are add-on effects; due to the warming and extra CO2, there is definitely more greening [8] and there are better crops. This is provable. The extra greening is trapping more heat causing higher minima and it is also changing the earth’s albedo [9]. The land and the oceans are getting greener i.e. blacker, looking from the outside in. This also traps heat [10]. There is a strange paradox here that most people are not aware of. Whilst we are encouraging people to plant more trees and make the earth greener so that more CO2 from the air is removed, this simply adds to the warming effect. Note the lecture by Prof. Happer about why plants are breathing better, giving better yields and becoming more drought resistant due to the increase of CO2 in the air [11].
Are there other sources of heat?
Yes. The variability of the heat that we get from the sun (‘the weather’) has already been mentioned [1]. The ice cores from Greenland [12] showed that there has also been a noticeable increase in warming every 1000 years or so during the recent half of the Holocene, especially in the NH, the so-called Eddy cycle [13]. Indications are that this extra heat came mostly from the bottom of the arctic seas and from the arctic areas [14].
What about the error?
Be aware that mercury thermometers do get an error over time due to the reaction of mercury with glass. Scientists only became aware of this around the 1960’s when mandatory yearly calibrations were introduced in the respective quality standards. Since the beginning of the 70’s, thermo-couples were introduced which should also still be calibrated every year. These are connected to computers and recorders and are able to do measurements every second or minute and therefore present a true result of the mean, the maximum and the minimum, at the end of the day. This whole procedure is of course a complete change in instrumentation, method and observing compared to the past. To look back is therefore not as simple as it looks. In my summary of results of 10 weather stations in South-Africa [15], I noticed a distinct jump, usually around 0.2 or 0.3K going from the 50-60’s to the +70’s. I remember becoming suspicious about this. These observations made sense to me in the light of my reasoning that the reaction of glass with mercury would tend to give lower results, in the past. I also think that most thermometers in the past did not even have a reading scale accurate to 0,1K or 0,1 degree C.
Where are we standing now?
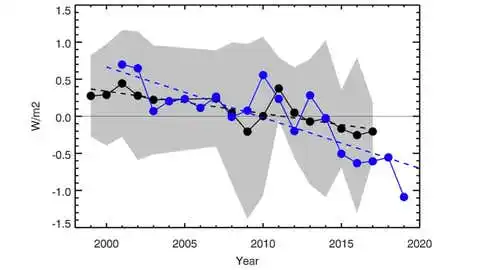
So, again with a ‘big if”, bearing in mind that the average reported results from before the 1970’s might have an error of as much as (0.3), let us make that dubious decision that all the global measurements that we have from 1850-1970 are all correct. In this case, you can see in the graph below that the AVERAGE warming anomaly (blue line) went from -0.5K to +0,5k since 1850 until now. The total amount of global warming therefore now stands at just about 1K or 1 degree C.
Wood for Trees: Interactive Graphs
From the satellite measurements UAH6 (green line) it appears that we are currently warming at a rate of about 0.14K per decade. At this rate, it would still take another 4 decades before we reach the ‘tipping’ point of 1.5 degrees C, mentioned in the Paris Agreement. But where does the idea come from that 1,5K of warming is going to tip the earth? It is ridiculous. Even in the time of Jesus it was warmer than that [16]. Or where does the idea come from that we are already at or near +1,5K? It appears that in the latest reports they went back further from 1850 to 1750 AD. But there are no global data from 1750 to 1850? This simply means that they are using proxies. Like tree rings, or deposits of certain seeds or leaves in sediments of old dry lakes, etc. Well, you know what proxies are – you can already hear it in the word: they are at the very best just approximations. I have no idea how they can give a good representation of the GLOBAL temperature. I think it just depends on who is behind the steering wheel of the investigation as to what result you end up with. In the case of tree rings, it was of course mainly Michael Mann who came with his fraudulent hockey stick graph. Most recently, it looks like he is finally being brought to justice, by Mark Steyn. See the opening statement by Mark Steyn in the relevant lawsuit [17].
How about if we think ‘inside’ the box?
Imagine: we are living in a big boiler, one-third above the level of water. The water came to temperature from the beginning, and we are now being kept warm mostly by heating from the top and some of it from the bottom. If we get too much heat, clouds are formed; they deflect the warmth from the sun. If it gets too cold, there are less clouds (=less rain = less crops!) but eventually more heat from the sun enters in the waters around us. Amazing, is it not? It works like a thermostat. Global warming is not really a problem. Excessive global warming is not possible because the box that enabled to give us life will just keep on correcting itself, keeping us cool…..
What if it were the other way around? What if it was cooling rather than warming?
Global cooling scenarios are truly frightening. I remember seeing a drawn picture of a horse during one of the Napoleonic wars where the horse’s tail had fallen off after a big freeze overnight. Cooling periods are often associated with droughts and failing crops – which makes sense if you think about my box model. Cooling can come about from impacts by meteorites or asteroids or exploding volcanoes, that bring so much dust and acids up in the air that the sun’s radiation cannot reach the earth anymore. It is during these times of global cooling that many an empire came to end or that whole nations went on the move, looking for greener pastures. Take the time to watch the video below about a cooling period that came after 536 AD and you will be glad to live in 2024!!
Foot Notes
[1] Henry Pool, 2019
https://breadonthewater.co.za/2019/09/22/revisiting-the-87-year-gleissberg-solar-cycle/
Dutch version: https://www.climategate.nl/2019/10/84861/
[2] e.g see https://e360.yale.edu/features/climate-change-upper-atmosphere-cooling
“The same gases that are warming the bottom few miles of air are cooling the much greater expanses above that stretch to the edge of space.”
[3] e.g see:
[4] John O’Sullivan, 2016
https://principia-scientific.org/industry-experts-co2-worse-useless-trapping-heatdelaying-cooling-2/
[5] Seim & Olsen, 2020
https://www.scirp.org/journal/paperinformation.aspx?paperid=99608
[6] Joseph van Reynen, 2022
https://principia-scientific.com/wp-content/uploads/2023/02/SaturationIIIupdated.pdf
[7] Henry Pool, 2022
https://breadonthewater.co.za/2022/12/15/an-evaluation-of-the-greenhouse-effect-by-carbon-dioxide/
[8] Henry Pool, 2022
https://breadonthewater.co.za/2022/01/10/global-warming-due-to-ehhh-global-greening/
[9] John Christie et al, 2006
https://journals.ametsoc.org/view/journals/clim/19/4/jcli3627.1.xml
[10] see:
https://breadonthewater.co.za/wp-content/uploads/2023/01/albedo1674915190404.webp
[11] Prof. W.Happer, 2023
[12] Foresight editor, 2009
Some Historical Perspective – Foresight Institute
[13] Henry Pool, 2021
https://breadonthewater.co.za/2021/03/04/the-1000-year-eddy-cycle/
Dutch version: https://www.climategate.nl/2021/03/de-duizend-jarige-eddy-cyclus/
[14] See Table 1: It is the earth itself, stupid!? | Bread on the water
Dutch version: https://www.climategate.nl/2022/08/mondiale-opwarming-hoe-en-waar/
[15] Henry Pool, 2019
SUBMISSION by Henry Pool.docx (dropbox.com)
[16] Isabel Cacho, Giulia Margaritelli and Albert Català, from the Faculty of Earth Sciences and the Consolidated Research Group on Marine Geosciences of the University of Barcelona.
https://breadonthewater.co.za/2020/07/30/the-weather-in-jesus-time/
Dutch version: https://www.climategate.nl/2020/08/de-middellandse-zee-was-2-graden-warmer-in-de-romeinse-tijd/
[17] Mark Steyn, 2024
Mark Steyn’s Opening Statement :: SteynOnline
[18] In his report, Global Warming: Observations vs. Climate Models | The Heritage Foundation Roy Spencer argues that “The Direct Warming from a Doubling of CO2 Is Only 1.2°C” . He quotes this course Advanced topic: Climate sensitivity and feedback — The Climate Laboratory (brian-rose.github.io) as the source.
Now, assuming again that the greenhouse effect of CO2 is just as great as that of water vapor. I refer again to footnotes [4], [5], [6] and [7], showing that that assumption is possibly wrong. But if we accept ‘the science’ about that +1.2K per doubling of CO2 as being correct:
In 1850 CO2 was 0.03%. So at 0.06%, if we achieve that one day, it would be +1.2K.
In 2024, CO2 was 0.04%.
So we have now had 0.01% of that 0.03%, so it becomes 0.01/0.03 x 1 ,2 = 0.4K, MAXIMUM, calculated from 1850.
[19] Arthur Viterito, 2015
Sci | Free Full-Text | Atmospheric Temperature and CO2: Hen-Or-Egg Causality? (mdpi.com)
Via e-mail, I received this comment from Arthur Viterito
Hi Henry,
Thanks for sharing! I enjoyed the article and also enjoyed the video that accompanied the article. Yes, both subaerial and submarine volcanism are massively underappreciated, even by a number of prominent “skeptics”.
Your discussion of anthropogenic CO2 was spot on. In fact, I’ve attached a few slides from one of my introductory weather and climate courses that derived virtually the same numbers you presented. Please keep in mind that I retired from teaching 7 years ago, so the numbers are slightly out of date, but nonetheless, they agree with yours. In light of some newer data that has emerged, I would argue that the anthropogenic loading is significantly less than the 1% of the GHG total that we calculated (please see: Sci | Free Full-Text | Atmospheric Temperature and CO2: Hen-Or-Egg Causality? (mdpi.com)
Art
“The truth is like a lion. You don’t have to defend it. Let it loose. It will defend itself.” St. Augustine
Thanks Arthur. I have made your presentation a foot note, [19]
This post is also available in Dutch,
https://www.climategate.nl/2024/02/opwarming-versus-afkoeling/
I notice from the responses (comments) on the Dutch site, that many people still do not understand how the greenhouse effect (ghe) really works. Where does the extra 33 degrees C come from?
The answer is simple, really:
Sunlight (UV/IR) on the oceans = water vapor = clouds = wind due to pressure difference = condensation on land = energy release. The ‘heat of condensation’ is the amount of heat released when water vapor turns to water. It is 2260 kJ/kg.
In the case of carbon dioxide (CO2) and methane there is of course no release of heat because 1) there is no condensation taking place, and 2) there is very little ‘mass’. These gases do not ‘stick’ together like water molecules (VanDerWaals) but rather behave like ideal gasses- spreading quite equally and evenly in all directions. That means that we can look at the IR spectra and determine accurately what their warming or cooling effect might be.
If you get this argument (!) you must click here:
https://breadonthewater.co.za/2022/12/15/an-evaluation-of-the-greenhouse-effect-by-carbon-dioxide/