+27 83 629-7690

North, south, east, west: Gas best!

In the interest of bringing an end to load-shedding, please pass this message on to the relevant powers-that-be!

There are good signs that the price of gas is coming down and that prices in future will be stabilising around the values as shown in the picture. Source of the picture: https://timera-energy.com/european-gas-prices-drop-to-pre-war-lows/

Gas powered power stations are apparently definitely cheaper now than wind energy. Source:

Gas-Fired Power Is Now Cheaper Than Offshore Wind Again | NOT A LOT OF PEOPLE KNOW THAT (wordpress.com)

There is currently a scarcity of solar panels in the world market and with both sun and wind there are also problems with the supply of certain parts and batteries. 

The burning of gas for power is pure: CH4 + 3O2 = > 2H2O + CO2.

Therefore, with gas there is no need to remove sulphur or sulphurous compounds.  That means that the old coal fired power stations that do not have the sulphur swiping ability  DO NOT HAVE TO BE SCRAPPED. In my opinion they could still be used and MODIFIED to work with gas rather than coal. A gas-powered power station does not have the problem like that of the coal fired power stations where you have to build a system to remove sulphurous compounds. When viewed in units of energy, gas has a 50% saving in the emission of CO2 compared to coal-fired power stations.

Good Climate News the Media didn’t tell you

Guest Post by Javier Vinós

No reasonably informed person would deny that climate changes. The climate has always been changing. Since 1860 the predominant climate change has been warming, which is fortunate because if we had winters like those of 1800-1850, we would be in for a shock. No one has been able to prove that global warming is primarily a consequence of our emissions. It may seem reasonable to assume that increased CO2 has contributed to warming since the mid-20th century when our CO2 emissions increased significantly, but no one knows how much they have contributed, no matter how much the Intergovernmental Panel on Climate Change (IPCC) insists that “humans are the dominant cause of observed global warming over recent decades.” (IPCC AR6, page 515)

There is no evidence for this statement. I know this because I have read thousands of scientific papers looking for it. The computer models are not evidence of anything but the showing of the programming skills of their authors. Models and their predictions are constantly changing and when our knowledge of climate changes, they must be redone.

The absolute lack of evidence contrasts sharply with the decision to cut our CO2 emissions to zero by completely changing our fossil fuel-based energy system and calling COa pollutant – when it is as essential to life as is oxygen. All this while most of the world doesn’t care about emissions and many are only on board for the promised money.

To get to the good news about global warming we need to look at variations in the rate of global warming, i.e., the speed of warming. Today we are going to use the satellite-calculated global temperature data from the University of Alabama in Huntsville, UAH 6.0. They are plotted in Figure 1.

Figure 1. UAH satellite global temperature anomaly data in °C relative to the mean from 1991 to 2020. In green is the linear trend of the series (+0.13 ºC/decade) and in blue is the linear trend since 2016. Data: UAH 6.0 Graph: Woodfortrees.

As we can see the temperature trend decreases since 2016, so 2022 is the 7th warmest year. For 7 years the planet has been cooling. Does that mean that warming is over? No, periods of 7 years of cooling are frequent in the record, there being 8 of them since 1979 and the warming continued. But there is only one period of more than 15 years of cooling, from 1998 to 2014, that appears in the record for the last 45 years. It is known as the ‘Pause’.

To analyze the evolution of the warming rate, we subtract from each monthly data the previous one to calculate the monthly increase. We then de-seasonalize the monthly increase by finding the 12 month moving average to remove a lot of noise. Finally, we calculate the 15-year average warming rate in C/decade by calculating the 180-month moving average and multiplying the resulting data by 120.

Figure 2. Evolution of the warming rate for 15-year periods between 1979 and 2022 in °C/decade and its linear trend, from monthly UAH 6.0 satellite temperature data.

Each point on the curve in Figure 2 is the warming rate for the 15 years before that month. The Pause shows up prominently as the only period with a negative rate. For the current cooling period to appear on that graph with a negative rate would require the global temperature to remain below the 2016 level at the end of 2030.

But the good news that no one is telling us is that global warming is slowing down. The 15-year rate was very high from the mid-1980s to the late 1990s, reaching 0.35 °C/decade. The average over the entire period of satellite records is 1.3 °C per century or 0.13 °C/decade, but the long-term trend has fallen from 0.16°C/decade to 0.10°C/decade today. The current cooling period is contributing to this decline in the long-term warming rate. This good news is not told to us, firstly, because it has been achieved without doing anything to reduce our global CO2 emissions, which calls into question the peremptory need to make a major effort to reduce them in the first place.

Second, we are not told this good news because the reduction in the rate of warming has taken place while rate of increase of atmospheric COis accelerating, as shown in Figure 3. Here, the data from NOAA has already been de-seasonalized, so we skipped this step. We follow the same process for the same period (1979-2022) as for the graph in Figure 2.


Figure 3. Evolution of the CO2 rate of increase for 15-year periods between 1979 and 2022 in ppm/decade and its linear trend, from deseasonalized monthly CO2 NOAA data

The problem with the theory of anthropogenic warming is now that while the rate of warming is slowing down, the rate of change of atmospheric CO2 is increasing, and in the same period it has gone from growing 14 parts per million (ppm) per decade to 23.5 ppm/decade. In other words, its growth rate has almost doubled.

According to the greenhouse gas climate change theory, it is not possible for warming to slow down while CO2 is strongly accelerating. The consequence of the CO2 increase on the greenhouse effect is well known. Each additional molecule intercepts infrared radiation, raising the average height of emission from the atmosphere and requiring an increase in surface temperature for the planet to maintain its radiative balance, that is, to radiate an energy equivalent to that which it receives from solar radiation. The theory does not allow global warming to slow with accelerating CO2 emissions. The theory is therefore wrong or incomplete. Apparently, there are fundamental things about climate change that we do not understand, that are capable of offsetting, canceling, and even reversing the effect of the CO2 increase on temperature. I have already proposed an alternative, which is not considered by the IPCC, in the Winter Gatekeeper hypothesis, based on changes in poleward energy transport.

[Comment by Henry Pool: consider also: It is the earth itself, stupid!? | Bread on the water ]

Thirdly, we are not bombarded daily with the good news that global warming is slowing down because the models predict just the opposite, which indicates that despite costing a fortune these models are useless. The 5th Coupled Model Intercomparison Project (CMIP5) was already projecting greater warming for the period 2006-2022 than has been observed. To the dismay of climatologists (Voosen 2022), the changes introduced in the CMIP6 models cause much more warming to be projected, so they have decided that, instead of averaging all models as was done in CMIP5, only the coolest ones should be averaged. Even so, the deviation between models and reality becomes more unbearable with each passing year (Figure 4).

Figure 4. In blue is the UAH 6.0 temperature anomaly data, in red is the CMIP5 mean projection and in green is the CMIP6 mean projection. The actual temperature is already more than one degree below what CMIP6 predicts. Graph by Charles May.

Other good climate news

2022 had in fact more good climate news that we haven’t heard about.

In September, sea ice reached a minimum extent of 4.87 million square kilometers in the Arctic. This is higher than the extent in 2007, which means the Arctic summer sea ice trend is zero for the past 16 years (Figure 5). We were told ad nauseam that the Arctic was melting, and Greenpeace used it to raise money from the unwary. Well-intentioned money which it used, among other things, to maintain the high lifestyle of its executives. The Arctic melted significantly between 1990 and 2007, but it has not done so for the past 16 years, and I don’t think it is because of the money given to Greenpeace.

Figure 5. Average Arctic sea-ice extent in the month of September between 2007 and 2022 with a linear trend. NSIDC data.

Also, with data available till September, sea level has risen only 2 millimeters in the first 9 months of the year. The decreasing sea level rise trend over the last 10 years continues (Figure 6). This indicates that sea level rise is probably linked to temperature rise, which is logical. Therefore, sea level rise models are at least as wrong as the temperature models, and those sea level rise figures of one meter or more that the media are trying to scare us with are ridiculous.

Figure 6. Annual mean sea level rise in mm/year and its linear trend between 2012 and 2022. NASA data up to September 2022.

It must be said that satellites measure a rate of sea level rise that is about twice that recorded by coastal tide gauges. Either the sea is rising more in the center than on the coasts, or there is a problem in measuring sea level rise to the center of the Earth that does not take into account what is happening at the bottom of the oceans.

In any case, the ridiculous sea level rise is only a problem in areas where there is subsidence by human action, due to groundwater extraction or excessive coastal construction. As an example of the non-existence of a serious problem here are two photos separated by 45 years of the same building located just 10 meters from the shore of the Mediterranean Sea, where I spend my vacations (figure 7). Coastal erosion has affected the profile somewhat, but the sea level does not appear to have risen detectably. The local Alicante II tide gauge shows a sea level rise of about 10 cm in 60 years or one-and-a-half millimeters per year

Figure 7. Sea level rise, although measurable, is negligible over the course of a human lifetime. The tidal effect is much larger

Despite all the continuous claims that climate change is making extreme events more intense and frequent, there is no data to support this, which is why the data are never presented. The IPCC reports do not conclude that extreme events are getting worse, except heat waves, which are definition dependent.

2022 has been a very quiet year in terms of hurricanes, continuing the downward trend since the mid-1990s in both frequency and energy (Figure 8).

Figure 8. Top, frequency of hurricanes with winds over 63 knots (upper curve) and over 95 knots (lower curve) between 1981-2022. Bottom, global (upper curve), and Northern Hemisphere (lower curve) cumulative cyclone energy between 1972-2022. Data from Ryan Maue.

I have already mentioned on occasions that in a warmer world, the temperature gradient between the equator and the poles is smaller, reducing the amount of energy to be transported and the intensity of atmospheric circulation, so we should not expect warming to increase the frequency of extreme events, just as we should not expect the global precipitation level to decrease.

Conclusion

2022 has been a good year in terms of climate, and it also reaffirms the positive trends toward a reduction in the intensity of climate change in many of the main indicators: temperature, Arctic sea-ice extent, sea level, and extreme phenomena. Let us not be fooled by those supported by our taxes. We have nothing to fear from climate change now or in the foreseeable future. Richard Feynman, one of the best physicists of the 20th century, said in 1966 that “science is the belief in the ignorance of the experts”, and Stuart Firestein teaches us that ignorance is the fuel that makes science advance. Those who believe they know what is wrong with the climate, who refuse to accept their ignorance, are not advancing science, but hindering its progress by slowing it down. They do not deserve to be called scientists because they do not serve the cause of science, which is to increase knowledge. They are only trying to line their pockets by defending an orthodoxy of clear political interest. It is clear why the climate panel is called “intergovernmental.”


Good Tidings!

Good Tidings!

I have some wonderful news! You will remember that in our previous newsletter we had asked for some special financial assistance to get the roof repaired of the “Share tears and grow” safehouse for abandoned and abused children here in Nelmapius? We had some wonderful help from a few overseas supporters and together with the local gifts we surpassed our target this week!! What a great Christmas gift!! Many thanks to all of you who gave a helping hand and a special word of thanks to Hart voor Kinderen in the Netherlands. We are hopeful that the work on the roof will start soon. We will keep you informed!

We also had such a remarkable experience a few weeks ago when we were visiting friends in Clarens. We were privileged to watch the Midlands Chamber Choir giving a performance of Handel’s Messiah.

Listen to the whole song here:

by Don Neuen - Crystal Cathedral Choir | The Messiah

The public watched in awe throughout the excellent performance. I must also say that the acoustics inside the little church in Clarens were very good. No need for any sound installation. It was an amazing performance, and the choir received a long and loud applause when the last “Hallelujah” was sung. 

The director then asked the public in the church if anyone had ever sung the “Hallelujah” (from Handel). What happened next was really something out of this world.  The choir divided itself up and went in between the public, as per alt, soprano and tenor and everyone then sang along. Watch the video below.

Just try and sing along! (Hallelujah)

by Don Neuen- Crystal Cathedral Choir | The Messiah

As we all sang the “Hallelujah” (Praise the Lord) together, we all felt the Spirit of God really coming down on us. Towards the end I could not sing anymore, because of the lump in my throat. I saw people with tears in their eyes and I am sure many felt the shivers along their spines, as I did. It was an unforgettable experience. So beautiful.

Jesus: our Wonderful Councilor, our Strong God, our Everlasting Father, the Prince of Peace (Isaiah 9:6).

Psalm 22:3 mentions that God actually lives and dwells in our praises. This is the mystery and the miracle of the breakthrough power and presence of God when we worship! When we worship, we affirm the truth of God’s Word, and it is being rooted deep in our hearts. Praise causes the presence of the Lord to come into our midst. When we praise, God comes in and leads us forth…our spirits are raised and our faith and trust increase.

Christ came into the world to bring us peace, no matter what the circumstance or chaos around us. Let us all celebrate Christmas again!

Wishing you a blessed Christmas and God’s richest for the year ahead! Please drive carefully and stay safe.

Henry and Annette

Oh Thou that tellest good tidings to Zion

by Don Neuen - Crystal Cathedral Choir | The Messiah

An evaluation of the greenhouse effect by carbon dioxide

An evaluation of the greenhouse effect by carbon dioxide

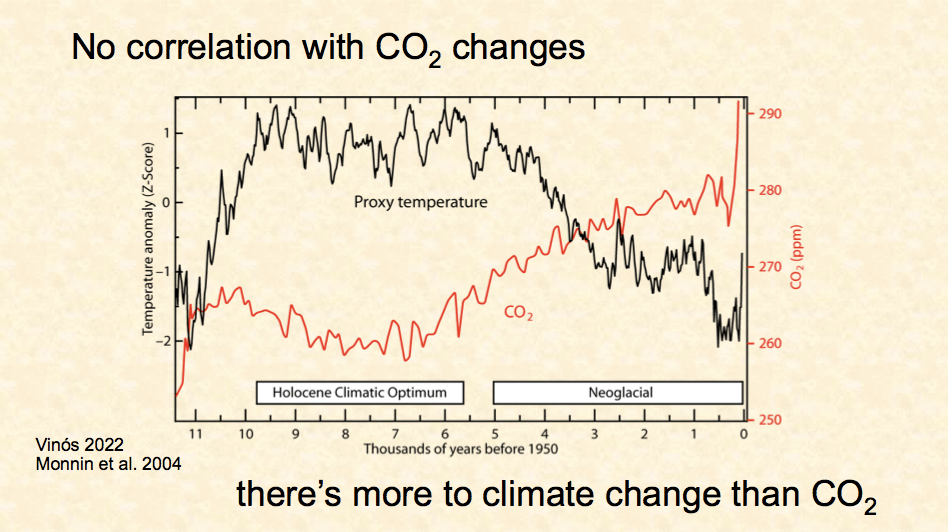
Fig.1:  A causal correlation between more CO2 and warming has never been proven.

I first try to explain in simple language how the greenhouse (gh) effect works. It is important that everyone who has anything to do with this effect at least understands what is happening. This definition was found on the internet somewhere: “it is the capture of the sun’s heat in the lower atmosphere of a planet, because of the greater transparency of the atmosphere for visible radiation from the sun than for infrared radiation emitted from the surface of the planet”.

This definition is misleading because it focusses only on a small aspect of the gh effect. This is not the main reason why a planet with water such as Earth is 33K warmer in the lower regions than a planet without water.  I show you schematically how the gh effect really works:

Sunlight (UV/IR) on water => water vapor => water vapor accumulates (sticks together due to strong VanderWaal forces) => cloud formations => there is movement of this moist air and clouds due to pressure- and temperature differentials => clouds and water vapor move to cooler areas => condensation takes place => heat of condensation is released in the air => this is equal to 2260 kJ per kg.

This is the main reason for the gh effect and it shows how heat spreads evenly all over the planet. Don’t forget this. That cold front coming up is really Mother Earth’s way to distribute the heat on our world to an average of about 14 or 15 degrees C. What the definitions in the textbooks want you to believe is that the main reason for the gh effect is that the gh gas slows or captures outgoing long wave radiation from Earth. That is also true, but it is only a very small aspect of the gh effect. Maybe just 5 or 10%?

You would have experienced this particular aspect for yourself in a few simple experiments: 1) You take a hot shower, turn off the tap and after ten minutes when you get out, you feel that the shower cabin is still warmer than the immediate temperature of the environment. The water vapor concentration that was relatively high and lingered in the cabin, retained heat and continued to radiate this, also to your body. 2) I remember that my mother mentioned that the weather was “sweltering” if it had been hot on a summer’s day and clouds rose late in the afternoon. The heat radiation from the ground then goes up to the clouds and returns again by the back radiation of the clouds.  3) On a completely cloudless day it happens that we reach for our sunglasses in the car while we drive away from the sun. So why is that? That is because, if the air moisture content is high, there can be back radiation from the water vapor in the spectrum of light and the wavelengths where we can ‘see’. Hence, 4) the colors of sunlight in the rain (rainbow) and the colors of a dewdrop. 5) This re-radiation or back radiation is also the principle of infra-red and UV & visible spectrophotometry. I remember that as a student I sometimes secretly lifted the cuvette holder a bit during a determination to see what happens when you turn the wavelength knob on the absorbing wavelength when measuring the standard solutions.  You can then see that the path of light is somewhat obstructed. The light goes back, mostly in the direction of the source, but also a bit round. That is why in my days we used to talk about ‘extinction’. The light goes extinct at the absorbing wavelength. The transmission of the light or radiation through the molecule is then lower. In spectrophotometry, the degree of extinction at a certain wavelength is therefore an indication of the concentration of a certain component (Lambert-Beer).

We can conclude from all these simple experiments that in the wavelength ranges where absorption of photons has taken place, the individual molecule begins to behave like a very small spherical mirror. You can compare it with turning on your headlights in foggy weather: the light goes straight back to the source. The strength of this emission depends on the size of the amount of absorption that takes place in the molecule. If we assume that the molecule of the gas is a perfect sphere, 62.5% of a certain amount of light (radiation) is sent back in the direction it came from. The rest goes around.

We have already seen that both clouds and water vapor provide a clear greenhouse effect because there is reasonable mass for radiation to each other, for storing heat, and for condensing and releasing heat in colder places. Apart from clouds there is still a reasonable amount of water vapor (H2O) in the atmosphere, namely an average of approx. 1% v/v at normal sea level or approximately 0.4 or 0.5% on average over the entire atmosphere. See: Atmosphere of Earth – Wikipedia However, to take an average of the water vapor content over the entire atmosphere may actually not be appropriate here. Molecules of water vapor and water accumulate and are usually also held together by each other at lower altitudes due to the interactive forces specific only to water. 

It is also important to remember that more than 99% of all gas in the atmosphere has almost no absorption and is therefore completely transparent for almost all wavelengths. Oxygen does have a tiny little bit of absorption at some very low wavelengths (see Fig.4 further down). So, apart from the greenhouse gasses, the entire atmosphere is actually transparent for all wave lengths. When our skin is exposed to sunshine, we become aware of the heat from the absorption of the radiation from the water just below our skin. Water has a number of absorptions and there is mass due to accumulation (vanderWaals) and therefore the radiation is converted into heat.  

So, now we come to the so-called greenhouse effect by carbon dioxide (CO2). In this case we must first of all find that CO2 does not have any condensation taking place like that of water. So it does not directly release any energy up in the air. The second main point is that green house gasses like methane and CO2 react as an ideal gas in a vessel. That means that they spread equally in all directions due to diffusion. The molecules of these gases do not stick together. We therefore only have to look at the optical properties of such gas  – i.e. what it does with the radiation that falls on it. Note that the amount of CO2 has increased from about 0.03% (315 ppmv) to 0.04% (420 ppmv) from about 50 years ago until now. The difference is indeed only 0.01% v/v. Compare this extra 0,01% now with about 50 times as much water vapor in the atmosphere and even more than 100 times as much water vapor at normal sea level. That is all excluding clouds. See Fig.2

Fig. 2: Water vapor up to ca. 3 km, where the gh effect is relevant, is still ca. 1 % v/v (10000 ppmv), 100 x more than the observed increase in CO2 over the past 50 years.

Now, carefully look at the Infra-Red spectrum of CO2

Fig.  3: The Infra-Red spectrum of carbon dioxide (CO2)

The more absorption, the lower is the transmission of radiation through the molecule, the more of that specific radiation is back radiated. The scale of transmission (y-axis) is sometimes multiplied by 100x to indicate the percentage of transmission through a gas or liquid.

The spectrum shows that, indeed, CO2 absorbs strongly in the region 14-15 um where earth also emits strongly. Remember that every CO2 molecule that has been added to the atmosphere is actually surrounded by hundreds of other molecules that are mostly completely transparent to the back radiation / emission by the CO2. So what happens is that the rising radiation of 14-15 um from the earth does bump into the CO2 molecules, but then it is radiated back, as mentioned, approx. 62.5% in the direction of the source. That means that that radiation is partially coming back to earth, where it can cause some warming if it eventually comes into contact with water/water vapor/clouds that has mass (water also has absorption at 14-15 um) or perhaps comes into contact with some other molecules of CO2 or water vapor that have not yet absorbed at 15 um. 

At this point in time the question arises: But what about the other absorptions of CO2 such as those at 4.3um and 2.3um that are clearly in the spectrum of the sun, not that of earth. There are also other absorptions of CO2 that were not visible with the measurement method used in Fig. 3, namely those in the nearby infra-red. Fig. 4 shows the spectrum of earth’s light in the nearby IR, as captured or displayed with instruments on Earth via the dark side of the moon. Source here

Fig. 4: Re-radiation from greenhouse gases (no clouds) in the nearby Infra-Red 

(via the moon back to earth – green line is back radiation by CO2)

We now see that light from the sun that fell on a CO2 molecule e.g. around 2um, was absorbed, and then reflected into space by the molecule (green line, Fig. 4). We can measure this emission via the reflection by the moon. Schematically, what is represented by Fig.4:

Sunlight to the earth = > absorption of radiation by CO2 = > radiation back to the source and to space = > therefore also to the moon = > via the dark side of the moon back to the earth = > to the measuring instrument.

The problem of a possible greenhouse effect due to CO2 now lies at the point that due to the relevant gas laws there can be no accumulation of that gas in the lower atmosphere, and subsequent condensation as is the case with water (clouds) and water vapor. CO2 is ca. 410 parts per million, man is claimed to be responsible for 100 ppm since the start of the industrial age. Even that claim is debatable as due to Henry’s Law there is also extra CO2 outgassing due to the increasing temperature of the oceans.  Never mind that, just remember that every added CO2 molecule is surrounded by ca. 10,000 other molecules in the atmosphere. I am saying that there is no mass for heat absorption except by the single molecule CO2 itself amidst 10000 other molecules after which it starts emission.

As a result, we can simply evaluate the effect of more CO2 directly by calculating the energy of the radiation of CO2 back to the earth and comparing this with the energy of the back radiation by CO2 to the sun and space. 

And here’s my moment to open the champagne. The electromagnetic radiation from earth is generally misrepresented as a ‘blackbody’ type of distribution that starts at 4 um (Wikipedia/ KNMI). But something is not right there. Here is the state of affairs as presented in a textbook by Petty and apparently relies on actual measurements that have been carried out. The source is indicated in the description below the graph.

Fig. 5 = Fig. 8.2 (above)

What does all of this mean?

This being the case, we can actually do a simple calculation over all wavelengths of Fig. 3 + Fig. 4. All radiation to earth below 22 um relevant to CO2 comes from the sun for 12 hours a day, on average. The radiation from earth runs upwards from 6 um to 22 um for 24 hours a day. The amount of energy caused by the obstruction of radiation by CO2, both by the radiation of sun and earth radiation, is compared with each other. The amount of energy per blocked wavelength over the entire spectrum of CO2 can be calculated piece-by-piece with Wien’s Law here. Each piece is also multiplied by the transmittance between 0 and 1. Because: the lower the transmission, the greater the obstruction by the CO2 molecule. I’ve done all that here:

Summary of analysis CO2 spectrum NIST (1)

The results of my calculations are in the first three rows of columns K, L and M. Note that the total cooling effect (by the back radiation from CO2 to the sun and space) was divided by two, since the sun shines on average for 12 hours per day while earth shines for 24 hours a day.

CONCLUSION

Just as I have always suspected, the result is negative: there is in fact no warming due to the addition of more CO2 in the atmosphere. Below is a list of studies by people who have investigated same problem in different ways and somehow have come to the same conclusion.

 John O’Sullivan (HT: Alan Siddons) 2016

Industry Experts: CO2 Worse Than Useless in Trapping Heat/Delaying Cooling | Principia Scientific Intl. (principia-scientific.org) 

  1. Seim & Olsen 2020

The Influence of IR Absorption and Backscatter Radiation from CO2 on Air Temperature during Heating in a Simulated Earth/Atmosphere Experiment (scirp.org) 

  1. Rasool and Schneider (see Science 173, 1971 138) https://www.science.org/doi/abs/10.1126/science.173.3992.138
  1. Joseph Reynen 2022 https://principia-scientific.com/wp-content/uploads/2023/02/SaturationIIIupdated.pdf 
  1. Ronald D. Voisin 2022

An Engineer’s Climate Theory – January_ 2022.pdf(Shared) – Adobe cloud storage

6. Roger Ian Holmes
https://sciencepublishinggroup.com/journal/paperinfo?journalid=161&doi=10.11648/j.earth.20170606.18

Fig. 6: Carbon dioxide is not affecting maximum temperatures.

Let us celebrate Christmas!!!

Let us celebrate Christmas!!!

Psalm 22:3 mentions that God actually lives and dwells in our praises. This is the mystery and the miracle of the breakthrough power and presence of God when we worship! When we worship, we affirm the truth of God’s Word, and it is being rooted deep in our hearts. Praise causes the presence of the Lord to come into our midst. When we praise, God comes in and leads us forth…our spirits are raised and our faith and trust increase.

We really experienced this the other day, when we watched the performance by the Midlands Chamber Choir doing Handel’s Messiah. Midlands Chamber Choir | Hilton | Facebook

Watch the video below.

Listen to the whole piece here:

by Don Neuen - Crystal Cathedral Ministries Choir | The Messiah

The public watched in awe throughout the excellent performance. I must also say that the acoustics inside the little church in Clarens were very good. No need for any sound installation. It was an amazing performance, and the choir received a long and loud applause when the last “Hallelujah” was sung. 

The director then asked the public in the church if anyone had ever sung the “Hallelujah” (from Handel). What happened next was really something out of this world.  The choir divided itself up and went in between the public, as per alt, soprano and tenor and everyone then sang along. Watch the video below.

Just try and sing along!!

by Don Neuen - Crystal Cathedral Choir | The Messiah

As we all sang the “Hallelujah” (Praise the Lord) together, we all felt the Spirit of God really coming down on us. Towards the end I could not sing anymore, because of the lump in my throat. I saw people with tears in their eyes and I am sure many felt the shivers along their spines, as I did. It was an unforgettable experience. So beautiful.

Jesus: our Wonderful Councilor, our Strong God, our Everlasting Father, the Prince of Peace (Isaiah 9:6).

Let us all celebrate Christmas again!!

Wishing you all a blessed Christmas and God’s richest for the year ahead.

Oh Thou that tellest good tidings to Zion!

by Don Neuen - Crystal Cathedral Choir | The Messiah