
The sword of Damocles behind the curtain of Earth’s global warming: a review
I must admit that the title of this paper got me interested in reading it, here is the relevant link to the paper:
The Sword of Damocles behind the Curtain of the Earth’s Global Warming: A Review
It made me look up the story about the Sword of Damocles. More about that later. I first show the abstract of the report, some results and the conclusions of this paper. I then offer a simple solution for the de-correlation between CO2 and temperature that apparently happened 128000 years ago (Fig. 5).
Abstract
The “mainstream” climatology (MSC)—i.e. which includes the Intergovernmental Panel on Climate Change (IPCC) community—considers the present-day massive release of greenhouse gases into the atmosphere as the main cause of the current global warming trend. The main inference from this stance is that the increase in temperature must occur after the release of greenhouse gases originating from the anthropic activities. However, no scientific evidence has been provided for this basic notion. Earth paleoclimatic records document the antecedence (=precedence) of temperature over CO2 levels. For the past 65 Ma, the temperature parameter has controlled the subsequent increase in CO2. This includes the three rapid aberrant shifts and extreme climate transients at 55 Ma, 34 Ma, and 23 Ma [1]. The simple fact of their existence points to the potential for highly nonlinear responses in climate forcing. Whatever these shifts and transients are, CO2 remains a second order parameter in their evolution through time. Confronted with the past, a suitable response must therefore be given to the unresolved question of whether the CO2 trends precede the temperature trends in the current period, or not. The assertion that the current global warming is anthropogenic in origin implicitly presupposes a change of paradigm, with the consequence (the increase in CO2 levels) that occurred in Earth’s past being positioned as the cause of the warming for its present day climatic evolution. The compulsory assumption regarding the antecedence of CO2 levels over the temperature trends is associated with the haziness of the methodological framework—i.e. the paradigm—and tightens the research fields on the likely origins of global warming. The possible involvement of an “aberrant” natural event, hidden behind the massive release of greenhouse gases, has not been considered by the MSC. Keywords Climate, CO2, Temperature, Paleoclimate, Warming
Results: The de-correlation of temperature and carbon dioxide increase:
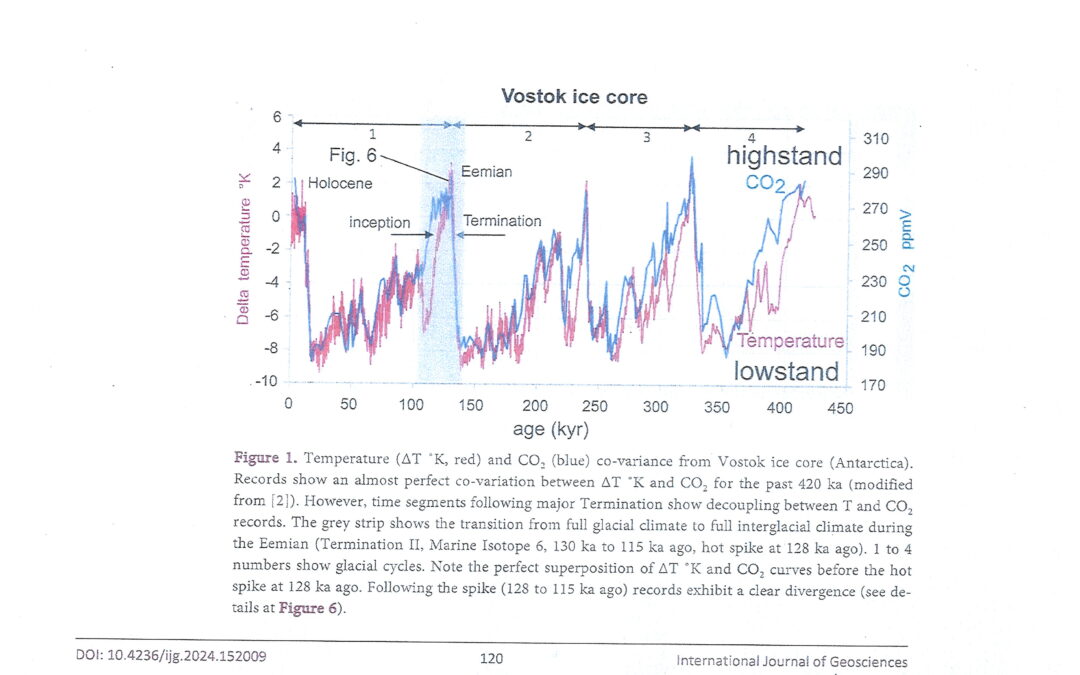
Ice coring at the Vostok site (Antarctica) has allowed recovering samples whose age covers the past 400 kyr. Before the Eemian climatic optimum at ~128 ka (Figure 1), the temperature covaried in a close correlation with CO2. This occurred during the short phase—i.e. less than ~15 kyr—of global warming at the end of cycle 2 (Figure 1). After the climatic optimum at ~128 ka, CO2 remained stable at approximately 274 ppmv (Figure 5) untill 114 ka, while the temperature decreased by approximately 4.5˚K. The decrease in temperature preceded that of the partial pressure of CO2 in the atmosphere. Therefore temperature and CO2 can evolve independently over a long period of time. Additionally, it should be noted that temperature and CO2 exhibit a similar relationship over time, at least for the past 400 kyr. For the four past climate cycles (Figure 1), temperature and CO2 exhibit a clear decorrelation during Earth cooling phases.
The correlation/decorrelation fluctuation appears to be modulated with a time constant controlled by orbital parameters. A long-term projection of orbital parameters without taking into account the anthropogenic effects shows that the Earth climate is heading toward a new glacial cycle [18]. Since the planet is currently in a period of climatic optimum comparable to that of the Eemian, it would be useful for scientific concerns to free themselves from injunctions of evidence to study in more detail one or more decorrelation scenarios between temperature and CO2 (See Figure 5 below). A comprehensive study of the decorrelation time period extending from 128 to 114 ka would be appropriate to appraise the Earth climate future in a more open way.

Conclusions
The evolution of orbital parameters controls the insolation — i.e. the temperature of the Earth through time. This in turn induces the periodic variations in the Earth’s climate, at least for the past 800 kyr. Ice coring (in Antarctica, and Greenland) documents a close covariation of temperature and CO2 content in the atmosphere during time periods of Earth warming (Figure 1). In contrast, a strong decorrelation of these two parameters characterizes the time periods of a cooling Earth extending from climate optimums to terminations. No evidence exists documenting CO2 antecedence over temperature during warm/cool Quaternary cycles. During the Cenozoic, major events, such as the Late Paleocene Thermal Maximum or the glacial event that was initiated by the appearance of the Antarctica ice sheet at the Eocene-Oligocene boundary were primarily thermally controlled. The associated CO2 content variation in the atmosphere occurred in the wake of thermal events through second-order forcing, positive or negative. Conversely, the MSC considers the massive release of greenhouse gases in the atmosphere to be the main cause of warming in recent decades. This entails an implicit paradigm shift since the cause during the past history of the Earth then is presented as the consequence for the present time. This basic point is not demonstrated or even discussed. Qualified as “virtually certain”, this becomes an axiom for the MSC models. By using ad hoc sensitivity parameters in their “effcient climate model” [17] discussion regarding CO2 antecedence over temperature and associated paradigm shift can be avoided. Basically, the MSC scientific community proposes models built on the idea of CO 2 antecedence over temperature. Because no evidence exists for this antecedence, something must be done to to palliate this gap. This will entail testing the efficiency of the models for reproducing parameters characterizing the climate evolution for specific time periods of the Earth’s past. Because these time periods are entirely controlled by the antecedence of temperature, it makes no sense to test a model based on the reverse—i.e., CO2 antecedence over temperature—. The back and forth from one paradigm to another (from Catastrophism to Actualism) explains, at least in part, the failure of the models as noted by Koonen [13]—i.e., “Many muddled models” p. 77-96.
Considering that the antecedence of CO2 over temperature has not been demonstrated, other avenues of research should be explored to characterize the possibility of an origin, not yet identified, of the current increase in temperature of our planet. If accepting that the main target is fighting against global warming, it is imperative to explore its potential origins in an exhaustive way.
The Earth’s climate is currently in a climatic optimum phase (warm) comparable to the Eemian (128 ka). At that time, our planet was at the dawn of a shift toward a new glaciation [18]. The current warming could be just a short-lived incident masked by anthropogenic emissions. Yet, between 128 and 114 ka a decorrelation existed between the CO2 and temperature. For 14 kyr, CO2 remained stable, while the temperature dropped even though these two parameters are usually linked. Understanding the climatic process at the origin of such de-correlation can represent a way out for the climate anthropic dogma.
End of my citations from this report.
NOTES (by Henry Pool)
It is important that any party/person interested in climate change understands the graphs shown in this post. When we look at them, we must remember that we are looking at proxy measurements. Some of these are not exact measurements, but it is simply comparing factor x with factor y where we know that there must be a relationship between x and y and/or other related factors. The Vostok core analysis is from Antarctica and certainly there are difficulties in assuming that the observed relationships, if at all valid for Antarctica, are also valid for global conditions, especially when taking it from there to the tropics or even to the subtropics.
The lesson from the Sword of Damocles is that great privilege comes with great peril. Our privileged position — life as we have known it — is that of the late Holocene, a brief period akin to the lifespan of the Syracuse monarch (Dionysius). The Sword, hanging perilously by a single horse-hair ‘thread’ above the King’s head, is a metaphor for the life-ending glaciation certain to follow when the thread snaps (the present warm period abruptly ends). Geologists (& others) today are in the position of the servant (Damocles) to whom the imperiled status is dramatically revealed, only when he is seated in the king’s place. How does this revelation occur? The Sword, hanging by a Thread, is obscured by a high Curtain, representing our fascination with the current warming and its correlation with the changes in atmospheric gases. Only when Damocles is seated in the king’s position, behind the Curtain, can he look directly at the mortal peril.
Bourgois (2024) dramatizes our present predicament by means of this analogy, in order to show how we we can move ‘behind the Curtain’ of our ignorance. As one means toward that end, Bourgois focuses on the paleo-antarctic record of the most recent (Eemian) interglacial (warm period) and a curious feature of how it ended — profound & rapid cooling, starting millennia-long in advance of changes in gas composition, nothing like the present-day close correlation ~ 150 ppm per 1.0 C change in sea-surface temperature – see The mystery of the missing human-generated carbon dioxide | Bread on the water
The message is clear, if not plainly stated: today’s mild climate and its correlated (non-causal) elevated GHG concentrations offer no sure protection against a sudden cold-dry-extinction. Hopefully, advancements in technology will enable modern society to mitigate or address the challenges presented by an impending ice age.
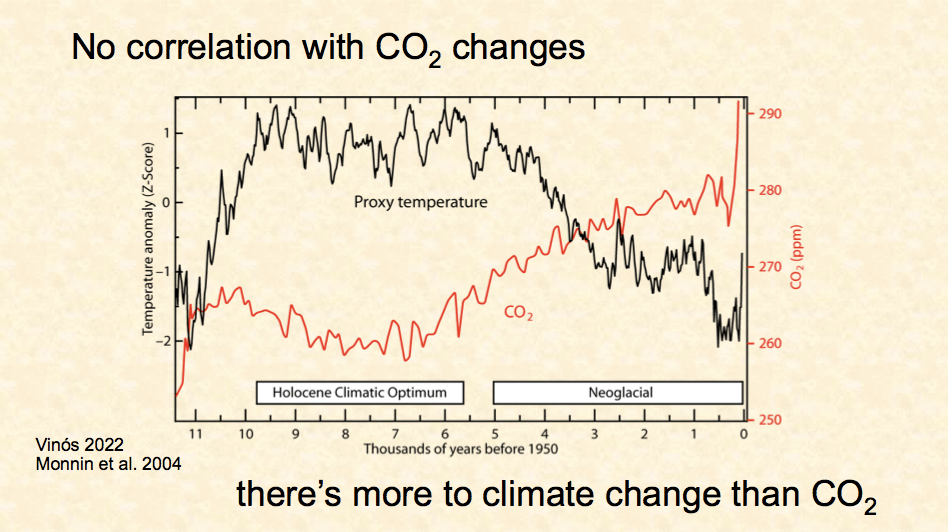
Note (Fig.1) that there is a close relationship between carbon-dioxide and temperature. Most scientists – and even ChatGPT – agree that there is a lag between the increase of temperature and the increase of carbon-dioxide of about 200 to 800 years. That means that the increase in carbon-dioxide in the atmosphere always follows the increase in temperature. Not the other way around! This implies that CO2 is not the cause of the warming. Also, for each additional degree Kelvin, the amount of CO₂ increases by ca. 10 parts per million. This result has been used by many people to show how much carbon dioxide is coming naturally into the air from delta T and how much from anthropogenic activities. In my honest opinion this is wrong for at least two reasons, namely, a) to assess temperature in the ice core of Antarctica some proxy was chosen – i.e. man did not yet exist to take the exact temperature at that place so we are relying on some comparison – and b) you are taken the relationship between delta T and delta CO2 as measured in Antarctica in the ice cores to be true, globally, for the current warm period. I think such steps are scientifically irresponsible. For this reason, I prefer to cite the measurements recorded by the late Professor Endersbee, as quoted.
Fig. 5 is the big puzzle. We observe that from 128000 years ago to 114000 years ago, the temperature keeps on dropping, yet the carbon dioxide content stays virtually unchanged. The author brings this problem to all of us and then he says: ‘Understanding the climatic process at the origin of such de-correlation can represent a way out for the climate anthropic dogma’.
So, yes, please let me try?
I’m sure most of you are aware that there must be a strong relationship between the concentration of carbon dioxide (CO2) in the atmosphere and the heat of the water in the oceans (SST), summarized by the known chemical reactions (1) and (2):
HCO3- + UV/heat = CO2 (gas) + OH- (1)
Every year, approximately 100 billion tons of CO2 from the oceans are released into the atmosphere by the UV and heat of the sun (Roemps Chemie Lexicon). This happens mostly in and around the Equator. To maintain the balance of CO2 in the atmosphere, nature must dissolve a similar amount in places where the water is very cold, for example in the polar regions and the deep sea, etc.
CO2 (gas) + 2H2O (liq) + cold = HCO3- + H3O+ (2)
In this case, i.e. 128000 years ago (and to a lesser degree apparently also at the end of the interglacial period before that) it appears that due to the onset of global cooling, for some reason ice was formed quickly, more especially in and around the polar regions, completely closing off the sink areas where most CO2 (g) would react naturally, as per reaction (2).
Apparently, carbon dioxide does not react with snow on ice. Some CO2 content of earth may be affected by the drop in vegetation due to the fall in temperature but this will not be as much as due to the sudden end of the chemical reaction (2) with cold water.
What happened in the end is that CO2 remained high, globally, during the last glacial, as dictated by Henry’s Law. In the light of this, it now seems very probable to me that during the Eemian interglacial, the global carbon dioxide content was similar to what it is today. The slow drop in CO2 made it possible for life – probably even human life – to survive in the tropics and some sub-tropic areas.
Luck or intelligent design?
PS
It appears to me that J. Bourgois made a small error in Fig. 1. The indication “Inception” and “Termination” should be changed around. I suspect that initially he read the graph from left to right instead of from right to left.


Recent Comments