
Proof that God exists
Take a minute to listen to the evidence that God exists….

Spring newsletter 2025
Let us help the children!!
As spring brings new life, it’s also a time to reflect on children without homes or families. You will recall from our previous newsletter: Heart for Children News 04.07.2025 | Heart for Children that we were considering a new project to help abused and abandoned children. In this respect we had been approached by Fani Manganye and his wife Sinah of the Kingdom Fellowship church in Bethanie (near Brits). We are old friends from more than 20 years ago. They had already started with the construction of two safe homes for children on the church premises and asked for help from Heart for Children. During our first meetings they had informed us that neglect of children in the North-West province was very common and that as teachers they had to deal with this almost on a daily basis.
After the special support and well wishes that we received from our donors and supporters, and after prayerful consideration, Annette and I decided to go ahead with this project. We visited Fani and Sinah again on 27/7/2025. We had been invited to first attend the service of the church in the Losperfontein prison where Fani also ministers; this turned out to be a big blessing for us (Fani is indeed a very inspiring preacher and teacher!). After this, the Memorandum of Understanding between Heart for Children and Kingdom Fellowship was tabled and signed. The beginning of our official partnership was celebrated with some flowers for the ladies (see picture above) and a special lunch prepared by Sinah! We are confident that God will prepare a way for us for the benefit of the children in the North-West.
As a result of donations received during the past 2 months, we were already able to finance the construction of the roof for the two homes. The building of the roof has now started!! See pictures below.


The second phase of this project is to finish the interior of the houses such as flooring, ceilings, the plumbing, the lighting and the electricity on the inside. We are hoping and praying for contributions from you and the general public for this project.
Also, if you live in the North-West or in Gauteng, and if you are able to help us with anything for the homes, like good and durable furniture, appliances that are still in good working condition, kitchen utensils, bedding, or anything else that you can think of, we will make a plan to come and fetch this. Fani has offered the use of his bakkie for this purpose. This would most probably have to be during a weekend.
Any donation and any help will be much appreciated. To make a donation now, please click here:
If you can assist in spreading this newsletter to anyone you think can help us, please do so! Our contact details are below.
We wish you a lovely Spring Day and God’s richest blessings for the season ahead!
Annette Pool, e-mail: annette.pool@gmail.com, cel. 0834696875
Henry Pool, e-mail: henrypool@breadonthewater.co.za, cel. 0836297690
Fani Manganye, e-mail: manganyefp@gmail.com, cel. 0647242364
An evaluation of the green-house effect by carbon-dioxide (3)
In a previous article that I wrote, I showed that the classic evaluation of the so-called greenhouse effect (GHE) being in the order of 33K might be incorrect and that by the account of a few well known scientists, it could be smaller. But now, what if we are all mistaken?
What if there really were no GHE from CO2 at all?
Somebody who read my post, pointed me to a paper written in 2017 by Robert Ian Holmes. I show the abstract here:
Abstract: It has always been complicated mathematically, to calculate the average near surface atmospheric temperature on planetary bodies with a thick atmosphere. Usually, the Stefan Boltzmann (S-B) black body law is used to provide the effective temperature; then debate arises about the size or relevance of additional factors, including the ‘greenhouse effect’. Presented here is a simple and reliable method of accurately calculating the average near surface atmospheric temperature on planetary bodies which possess a surface atmospheric pressure of over 10kPa. This method requires a gas constant and the knowledge of only three gas parameters: the average near-surface atmospheric pressure, the average near surface atmospheric density and the average mean molar mass of the near-surface atmosphere. The formula used is the molar version of the ideal gas law. It is here demonstrated that the information contained in just these three gas parameters alone is an extremely accurate predictor of atmospheric temperatures on planets with atmospheres >10kPa. This indicates that all information on the effective plus the residual near-surface atmospheric temperature on planetary bodies with thick atmospheres, is automatically ‘baked-in’ to the three mentioned gas parameters. Given this, it is shown that no one gas has an anomalous effect on atmospheric temperatures that is significantly more than any other gas. In short; there can be no 33°C ‘greenhouse effect’ on Earth, or any significant ‘greenhouse effect’ on any other planetary body with an atmosphere of >10kPa. Instead, it is a postulate of this hypothesis that the residual temperature difference between the S-B effective temperature and the measured near-surface temperature is actually caused by adiabatic auto-compression.
Take the time to read the whole paper here:
https://sciencepublishinggroup.com/journal/paperinfo?journalid=161&doi=10.11648/j.earth.20170606.18
Holmes argues that the average temperature for 8 thick-atmosphere planetary bodies (0.1 bar or more) can be measured with high accuracy – an error range of only 1.2% – by using a formula based on the knowledge of 3 parameters: “[1] the average atmospheric pressure near the surface, [2] the average atmospheric density near the surface, and [3] the average molar mass of the nearby atmosphere.”
Holmes used the derived pressure/density/mass numbers for each planetary body. He then calculated the temperatures of the planets with these figures. The temperature of Venus was calculated to be 739.7 K with the formula. The measured temperature is 740 K. This indicates that the accuracy of the formula is within an error range of only 0.04% for Venus. Considering the pressure/density/mass of the Earth, the calculated temperature is 288.14 K using Holmes’ formula. The measured temperature on earth is 288 K, an exact fit. The calculated temperature of Saturn is 132.8 K. The measured temperature is 134 K – an error of only 0.89%. Apparently for Mercury, Mars and our moon the pressure would be too low to employ this method.
The impressive accuracy of the formula is shown in his Table 1 and in his Figure 2 of the paper (shown together here in one picture):

Discussion
After reading the whole report, the point that I think was the most convincing is the fact that Holmes calculated with an error of only 0.2% what the temperature at the South Pole is. Remember that most of the South Pole area lies at a height of almost 3000 meters above sea level, therefore the pressure and the air density differs considerably to that of earth between the -60 and +60 latitudes.
Using Holmes’ formula, how much is the effect of more CO2 in the air, exactly?
It appears that the molar mass version of the Ideal Gas Law points to a very low climate sensitivity. I quote exactly what is says in the report, my own comment in brackets [ ] :
‘In particular, formula 5 (and 6) as presented here, totally rules out any possibility that a 33°C greenhouse effect of the type proposed by the IPCC in their reports [23] can exist in the real atmosphere. The reason is that the IPCC state in their reports that a 0.03% increase in atmospheric CO2 (i.e. a doubling from pre-industrial levels) must result in a global temperature rise of ca.3°C; (a range of 1.5°C to 4.5°C, which has hardly changed since 1990) [24]. This is the so-called ‘climate sensitivity’. Anything like this magnitude of warming caused by such a small change in gas levels is completely ruled out by the molar mass version of the ideal gas law.
Calculation for a doubling of CO2 from the pre-industrial level:
T = 101.33/ (8.314 x 1.226 /28.98) [molecular weight of air changes only from 28.97 to 28.98 due to the doubling of CO2 from 0.03 to 0.06%]
Calculated temperature after doubling of CO2 from 0.03 to 0.06% ≈ 288.11K. Climate sensitivity to CO2 is ≈ 288.14 – 288.11 ≈ – 0.03K. The change would in fact be extremely small and difficult to estimate exactly, but would be of the order -0.03°C. That is, a hundred times smaller than the ‘likely’ climate sensitivity of 3°C cited in the IPCC’s reports and probably be of the opposite sign [negative]. Even that small number would likely be a maximum change, since if fossil fuels are burned to create the emitted CO2, then atmospheric O2 will also be consumed, reducing that gas in the atmosphere – and offsetting any temperature change generated by the extra CO2. This climate sensitivity is already so low that it would be impossible to detect or measure in the real atmosphere, even before any allowance is made for the consumption of atmospheric O₂.
Holmes’ conclusion
‘There can be no significant ‘greenhouse warming’ caused by greenhouse gases on Earth, or for that matter on any other planetary body. Instead, it is proposed that the residual temperature difference on Earth, and the tropospheric thermal gradient observed, are actually caused by adiabatic auto-compression.’
[Holmes’ paper clearly defines auto compression – same formula is also used extensively in the mining industry to direct the flow of air – and he also explains the proposed adiabatic mechanism].
Remember that his report is only one of many reports showing that the effect of more CO2 in the air is nothing or next to nothing:
The 1,5 degree C warming limit myth
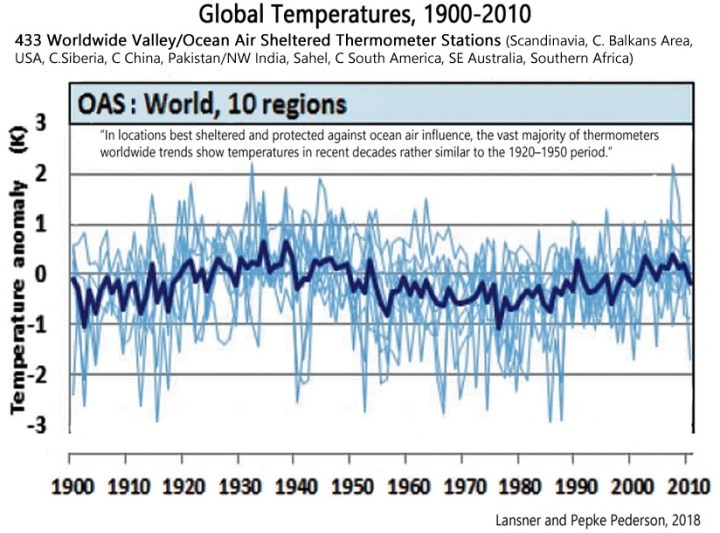
Take a few minutes to watch this video. Despite certain areas already having passed the ‘limit’ there is no ‘tipping’ point that has been noticed. In contrast with the NH, the warming in the SH is much lower. For example, in South Africa there has been hardly any warming at all:
No change in temperature in South Africa for more than 45 years! | Bread on the water
On its own this already proves that the warming of earth is not related to carbon dioxide, as the gas behaves like an ideal gas and spreads more or less evenly over the atmosphere. The rate of increase in CO2 is everywhere the same and therefore the increase in temperature should be more or less the same everywhere.
Skeptics win: Endangerment finding of CO2 is axed from the books of law!
Today is a monumental win for climate skeptics
Today’s decision by the Environmental Protection Agency (USA) to remove the Carbon Dioxide Endangerment Finding represents a pivotal shift in America’s approach to climate policy—one rooted in evidence, not ideology. For years, this “finding” has served as the legal justification for an array of costly, far-reaching regulations targeting everything from our nation’s power plants to the cars we drive and the energy bills we pay. Its removal is a direct response to mounting evidence that the basis for this rule was always more about speculative modeling and political maneuvering than sound science. Watch the announcement here:
Recent Comments