A word of caution on prosperity teaching
Take some time off to listen to the sermon of Louis Kotze on 20/7/2025 in Hatfield Christian Church. I thought that what he said, is important.

Take some time off to listen to the sermon of Louis Kotze on 20/7/2025 in Hatfield Christian Church. I thought that what he said, is important.

For the people who insist that man-made climate change will cause higher sea levels and subsequent flooding and floods, there is a new recent study that shows them wrong. As noted by me and others, CO2 concentrations in the air have nothing to do with the warming of the seas, nor with sea levels. The new study shows that the sea level of the Atlantic coast of Africa varied from 0.8 to 4 meters higher between 5000 and 1700 years ago compared to what it is today. So, sea levels around the Atlantic coast in Africa were at least 1 meter higher in the Roman Warm Period, when Jesus was born…….
For more information, see source:
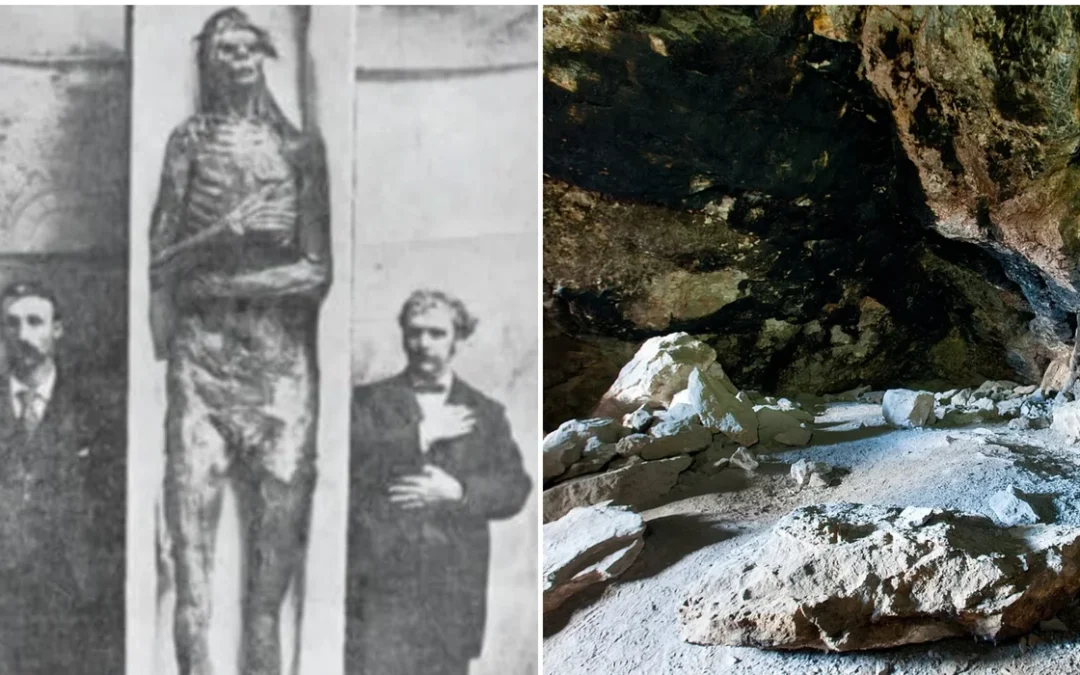
Mythology, folklore and even the Bible tell us that giants once roamed the Earth. And, it turns out, there’s evidence to back this claim. Extraordinary human remains have been found in the US state of Nevada, with some of the skeletons measuring up to 10 feet tall. Alongside their jaw-dropping size, the bodies – some of which were said to have been mummified – were found to have had red hair.
This has fuelled the theory, passed down through the ages, that a long-forgotten race of humans once [also] dominated southwestern America. According to the Paiute, a tribe that settled in the Nevada region thousands of years ago, cannibalistic, red-haired giants called the Si-Te-Cah came to the Americas from a distant island. Legend has it that the Si-Te-Cah crossed the ocean on rafts made of reeds, and they soon made a name for themselves as being taller, stronger and crueller than ordinary men. Then, in 1911, while digging for bat guano (a key ingredient in fertilizer) in a cave near the city of Lovelock, Nevada, some miners unearthed a number of strange objects. This prompted the launch of two official excavations in 1912 and then in 1924, during which thousands of artefacts were recovered.
Among the staggering finds were the mummies, nicknamed the Lovelock Giants, which measured between 8 and 10 feet tall, according to Archaeology World They also found 15-inch-long sandals that showed signs of wear and a boulder etched with what appears to be a giant handprint. Shortly after the second excavation, in 1931, an article published in local newspaper the Nevada Review-Miner, claimed that two giant skeletons had been discovered in a dry lake bed close to Lovelock. These remains measured 8.5 and 10 feet in height respectively, and were mummified in a manner similar to that employed by the Ancient Egyptians.
And while all of this may sound far-fetched, the legend of these strange people crops up all over the Americas. For example, in the sixteenth century, a Spanish conquistador, called Pedro Cieza de León, recorded an ancient Peruvian tale about the giants’ origins. In his account, de León wrote that the towering figures “came by sea in rafts of reeds [in] the manner of large boats” and that “some of the men were so tall that from the knee down they were as big as the length of an ordinary fair-sized man.” Furthermore, high up in the Andes, between Peru and Bolivia, skeletons with elongated skulls have been found. The remains are said to be around 3,000 years old and much larger than normal human ones. Intriguingly, some of them were also found to have red hair.
According to Archaeology World, some scientists attribute this reddish colour to the environment in which the bodies were buried. However, others view it as proof of the existence of the Si-Te-Cah and their kin. And if you’re wondering how such a strong and monstrous race came to disappear if indeed it ever existed at all, the Paiute have the answer. According to their mythology, the Si-Te-Cah waged war on them and all other neighbouring tribes, wreaking terror and destruction. After years of [in] fighting, the tribes united against this formidable foe. Eventually, the last remaining giants were chased away and sought shelter inside Lovelock cave. Seizing their chance, the tribes started a fire at the cave entrance, suffocating and burning alive the few Si-Te-Cah who were left. Interestingly, when the initial discoveries were made at the cave back in 1911, evidence of extreme burning near its entrance was found, the History Channel reports.
This article was originally published on 25 June 2024
Source: ’10-foot-tall people’ discovered in Nevada cave | indy100
Now look how all the threads of this story of giants seem to be coming together…if you truly look at all the evidence, for example, the giant statues of Easter Island, it becomes very difficult to deny the story. If you are interested in knowing more, start here:
Atlantis Rising? | Bread on the water
and finish here:


‘Evidence for Solar Modulation on the Millennial-Scale Climate Change of Earth’, by Xinhua Zhao, Willie Soon and Victor M. Velasco Herrera (2020). I show the abstract and summary & discussion of the results of the abovementioned study:
Abstract: we use available reconstructed data to investigate periodicities of solar activity (i.e., sunspot number) and the Earth’s climate change (temperatures of Lake Qinghai in China and Vostok in Antarctica, the GISP δ18O climate record of Greenland, and the stalagmite δ18 O monsoon records of Dongge Cave in China) as well as their cross-wavelet coherences on millennial scale. We find that the variations of the Earth’s climate indices exhibited the 1000-year cyclicity, which was recently discovered in solar activity (called Eddy cycle). The cross-wavelet correlations between the millennium-cycle components of sunspot number and the Earth’s climate change remains both strong and stable during the past 8640 years (BC 6755–AD 1885). The millennial variation of sunspot number keeps in-phase with variations of Lake Qinghai temperature, Greenland temperature, and East Asian Monsoon, but anti-phase with the variation of Antarctica temperature. The strong and stable resonant relationships between sunspot numbers and these climate indices indicate that solar variability may have played a role in modulation on this millennial seesaw pattern of the Earth’s climate change before the modern industrial era.
The results and graphs of this study can be found here: (1) Evidence for Solar Modulation on the Millennial-Scale Climate Change of Earth
Summary and Discussion: in this paper, we analyzed the reconstructed datasets to probe periodicities and cross-correlations between solar variability (SSN) and climate indices on Earth (summer temperature at Lake Qinghai (TQ ), air temperature at Vostok in Antarctica (TA ), temperature index at Greenland (δ18OG), and Monsoon index at Dongge Cave in China (δ18OD )) during the past 8640 years (BC 6755–AD 1885) before the modern industrial era. We find that the millennial-scale cycle is the only common oscillation between SSN and these climate indices on Earth during our study interval. The millennial-cycle components of SSN and climate indices have both strong and stable correlations. When solar activity is strong (numerous SSN), it will give warming effect on Greenland and Lake Qinghai, a strengthening effect on the monsoon in East Asia, but a cooling effect on Vostok in Antarctica. Conversely, when solar activity is weak (few SSN), it will create a cooling effect on Greenland and Lake Qinghai, a weakening effect on the monsoon in East Asia, but a warming effect on Vostok in Antarctica. These millennial variations account for roughly 10% of the total changes for both solar variability and climate change.
We also find that the climatic response to solar forcing in Vostok of Antarctica is opposite to those in the northern hemisphere (Lake Qinghai, Dongge Cave, Greenland). Similarly, Eroglu et al 2016 discovered a seesaw relationship of the Holocene East Asian-Australian summer monsoon over the last 9000 years at millennial to sub-centennial time-scales, and concluded that solar activity acts as a driver in the seesaw relationship between the East Asian summer monsoon and the Indonesian-Australian summer monsoon by shifting the position of the Intertropical Convergence Zone. The opposite changing trend in the millennial temperatures of two hemispheres had been discovered for 20 years [25–31], which can be termed the “northern-southern hemispheric seesaw”. More and more evidence indicates that this dynamic see-saw pattern seems to be a persistent feature of long-term climate change [27,28]. The complicated oceanic and/or atmospheric processes are thought to be possible explanations for this seesaw phenomenon, and the driving center of action for the millennial-scale seesaw could be initiated from the northern hemisphere [27,32]. In the case with emphasis on the northern hemisphere playing a leading role for millennial-scale oscillation or see-saw, an increase in the North Atlantic thermohaline circulation would warm the high-latitude northern hemisphere, but cool the southern hemisphere on a millennial scale [26,27]. The modeling based on the climate model demonstrated that the millennial variations of the northern temperature keep consistent with the global change, and only a small part of the very southern regions presents a converse trend with the global variation [29]. Therefore, we can give the following scenario: solar activity first generates positive feedback on the global Earth. For example, solar irradiance as well as geomagnetic storms produced by solar activities can have effects on the Earth’s atmosphere [33–35]. The positive feedback in the ocean-atmosphere system can also amplify the response to solar irradiance variations [36,37]. Then this global change will lead to negative feedback in the local Antarctic through complex oceanic and/or atmospheric processes. However, it is important to note that our study here is only based on data from four places on Earth. For future steps, we need to find more evidence from different places all over the world to verify this ‘north-south’ seesaw pattern as well as more credible physical mechanisms accounting for the seesaw oscillations between climate indices in the northern and southern hemisphere.
End quote from the paper.
Some of you will remember that I did write an article on the 1000-year Eddy cycle before, in 2021. See footnote 1 below. I was curious to find out if Dr. Willie Soon would respond to my question if the current warming of earth could be due mostly to the Eddy cycle as suggested by the graph depicted at the start of this post. I was indeed pleased and surprised to receive a quick response. He writes: ‘Many thanks for sharing your thoughts on the Eddy cycle…..the graph you used in your link is indeed correct. But I am sure you are aware that the realities are a bit more complex.’ He recommends that we watch the video where he mentions that the global temperature record is contaminated as we measure the temperature where we know it becomes warmer due to the increase in buildings, pavements and asphalt that we put around us. It also appears that the record for the variance in solar irradiance (parameters & data) has apparently been cherry picked by the IPCC. The video only takes about 15 minutes to watch.
We conclude from this paper & video:
1) There is undeniable evidence for a millennial solar/weather cycle, called the Eddy cycle, and that, indeed, we are approaching the top of the wave, experiencing more warming, just like it was a thousand years ago. There are numerous reports and papers confirming this. See the footnotes in footnote 1.
2) The seesaw pattern that was observed with warming moving in opposite directions of the hemispheres, as described in the paper, is in fact a perfect explanation for the results of my own statistical analysis in 2015 of 27 weather stations NH and 27 weather stations SH, showing little or no warming in the SH compared to significant warming in the NH. See Table 1, footnote 2.
3) In the video, Dr. Soon shows the results of a study of the warming in the USA where it was found that the effect of the Urban Heat Island (UHI) is considerable, namely 1.11K per century compared to 0.62K per century for non-urban areas. This is almost 80% (1.11-0.62 /0.62 x 100%) more. In my own latest statistical analysis of 11 weather stations here in South-Africa, I also noticed some significant warming in Johannesburg, Cape Town and East-London. compared to next-to-nothing elsewhere. In this case I also mentioned that the only reason to explain this, is the UHI effect, as these are the three cities that increased considerably, both in size and population. For all results in South Africa, see footnote 3
4) The results of this investigation here do not negate the probability that volcanic activity could play a role in the extra warming of earth that is being observed, during the Eddy cycle, especially in the NH. See footnote 4) and 5). In fact, a slight change in the position of earth’s inner core, due to some or other re-alignment with the magnetic field of the sun (magnetic stirrer effect), could help explain the difference in the phase of warming that is being observed between the two hemispheres.
5) Finally, I want to mention here that I think there is at least one major contributory factor to the warming that no one has investigated as far as yet, and it is a bit similar to the UHI effect. For example, I have noticed that the temperature of the water in the rivers ending up in the North Sea all seem to have increased at about the same rate as the water of the North Sea itself. Also, at the big nuclear energy power station here in Koeberg, we observed some fish were disappearing. Eventually it was found that this was due to the surrounding ocean water becoming warmer. These observations seem to support the argument that more and more water being used by industry for cooling purposes could have a serious warming effect, due to the increase in vapor pressure.
Evidence is mounting now that the extra little bit of carbon dioxide in the atmosphere caused by the burning of fossil fuels is not the cause or main cause of the extra warming…. See footnote 6.
FOOTNOTES
1)
The 1000-year Eddy cycle | Bread on the water
De duizendjarige Eddy-cyclus – Climategate Klimaat
2)
An Inconvenient Truth | Bread on the water
Een ongemakkelijke waarheid – Climategate Klimaat
3)
No change in temperature in South Africa for more than 45 years! | Bread on the water
Al meer dan 45 jaar geen temperatuurverandering in Zuid-Afrika! – Climategate Klimaat
4)
https://www.climategate.nl/2022/08/mondiale-opwarming-hoe-en-waar/
Oppervlakteluchttemperatuur (SAT) versus zeeoppervlaktetemperatuur (SST) – Climategate Klimaat
5)
What drives El Ninos? | Bread on the water
Waar komen El Niños eigenlijk vandaan? – Climategate Klimaat
6)
Recent Comments