
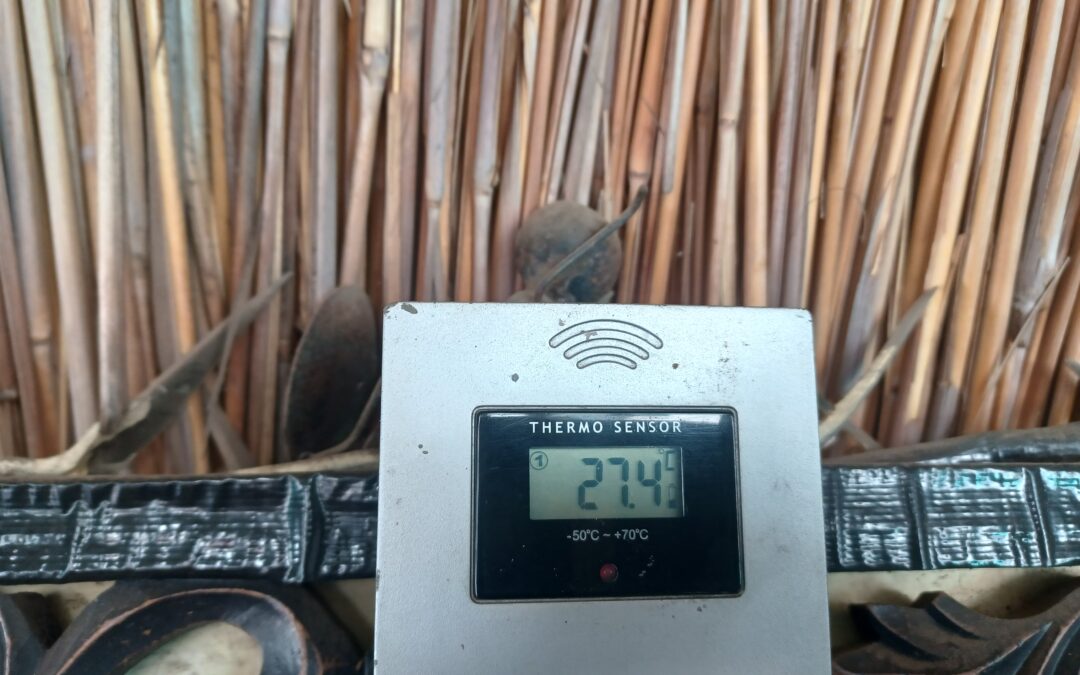
About 12 years ago, I became interested in looking at the whole global warming thing. It also just became a bit of a hobby for me. I found it interesting to look at the temperature (changes) at various places in the world. Since that time, I have a certain date in the year where I look at my own thermometer, under the lapa. It is a special day of the year because it is a holiday here (in South-Africa), namely Human Rights Day, so I would never forget to look. It is also the official beginning of autumn here (in South-Africa), as the sun stands 100% straight above the equator. Amazingly, every year I have looked, since then, the temperature on this day has consistently always been exactly 27C give or take half a degree, here in Pretoria. Unbelievable, right? I thought this year it would also be different, as we did have a particular warm summer. But I promise you, this year on 21-03-2024, the maximum temperature under the lapa again reached the 27 mark!
What can I say? One could say that there really has been no change in temperature here for us in Pretoria for the past 12 years. But what change would you expect to see over a period of 12 years? When I put my own data together I found that the warming of the earth was rather unequal. In South-Africa, I hardly found any warming, when I looked at it from 1977. My report on that is here:
SUBMISSION by Henry Pool.docx (dropbox.com)
and my data for ten weather stations in South-Africa is summarized here:
summary of climate change south africa.xlsx (dropbox.com)
As you can see from the data, the warming I measured in Pretoria was only 0.01C per decade from 1974 to 2018. However, for example, in Norway the picture was quite different. That made me wonder. People did not believe me when I told them. But now, since 1979, we also have satellites ‘measuring’ the temperature at the various latitudes. They also show the unequal warming of earth if you look at the change in degrees C/per decade/per latitude:

So, in the SH Extratropics, the average warming amounts to only 0,1C per decade, on average, 360 degrees (around the whole earth).
Now obviously, nobody can measure such a small change of 0,12C over 12 years in their own backyard…… so 27C is what it is and what it will be for many years to come….
How to explain these results in the graph? Truth is that the proposed culprit for the global warming, carbon dioxide, which is released by burning fossil fuels, is an ideal gas that distributes itself evenly in all directions. If carbon dioxide is the guilty party, one would expect to see that the warming per decade should be more or less the same everywhere you measure on earth. Then I noted other graphs showing that the warming rather seems to be coming from the oceans, not from the atmosphere! I explain the consequences here:
https://breadonthewater.co.za/2022/08/02/global-warming-how-and-where/
My final report on everything related to this subject is here:
https://breadonthewater.co.za/2024/02/03/global-warming-versus-global-cooling
Take your time to study these reports and let me know what you think! I love to see your comments.

Happy to have read your message
Thanks! This article is now also available in Dutch, see here:
https://www.climategate.nl/2024/03/27-2/