
Note that this post has been superseded with this one:
An evaluation of the green-house effect by carbon-dioxide (3) | Bread on the water
In hindsight, I should say that if we strictly were to compare actual measurements done at the surface of the moon near the equator (Tmean= -6C, see report below) and we compare this with actual measurements done on earth near the equator (Tmean= 27C, see link below), we still see an absolute difference of [33] K.
https://breadonthewater.co.za/wp-content/uploads/2024/12/Hato-Curacoa.jpg
What is the temperature of earth, on average?
Based on real measurements of temperature at measuring stations not far from the ground, the global average temperature on earth is estimated at 15 degrees C. This is 288K. However, there are many areas such as Greenland, the polar regions, the Sahara and other large deserts where no people live. Therefore, there are very few or no measuring stations in these places. Nevertheless, for the purpose of our investigation we decide to ignore this and accept that the average temperature on earth is about 288K.
What would the temperature be like if there were no water and greenhouse gases?
This is derived from Stefan-Boltzmann’s (S-B) law:
S = e*σ*T4 (1)
where: S is the amount of sunlight being absorbed by the surface in W/m2, on average. This takes the solar constant divided by 4 (to spread it evenly over both latitudes and the day and night cycle) and then accounts for 30% of light being reflected into space,
i.e. 1364/4 *0.70 =238.7 W/m2
where: e is emissivity of an object, generally set to 1.00 for an ideal radiator.
where: σ = 5.670*10-8 = the Stefan-Boltzmann constant
where: T is the temperature in Kelvin.
With the values given, the calculation is:
238.7=1.00 * 5.67 * 10-8 * T4 and this ends up with T= 254.7K, that is -18C.
The difference between 288 and 255 is 33K or 33 degrees C. This is indeed what most school textbooks are reporting as being the result of the so-called greenhouse effect.
I became interested in finding out if this 255K result is correct. I thought it would be best to look at the moon. According to NASA, (click on the link) the maximum temperature near the equator during the (lunar) day is + 121C and during the (lunar) night the minimum gets to – 133C. A lunar day and night together are 29.5 earth days. The rotation is so slow that we never see the ‘dark’ side of the moon. Roughly speaking then, I estimate the average temperature on the moon (121 + -133) /2 = -6 degrees C, or 267K. (With my back-of-the-envelope method, the length of the day and night does not really matter). So, 267K was my first rough estimate of the temperature of earth without water and an atmosphere. To compare, we can look at the more comprehensive reasoning and calculations by Andy May:
The Earth without Greenhouse Gases – Andy May Petrophysicist
Andy May came to an average of -8C. This is 265K.
Furthermore, in his post,
Errors in Estimating Earth’s No-Atmosphere Average Temperature « Roy Spencer, PhD
Roy Spencer writes:
“If I repeat the model calculations in Fig. 2 and only change the length of the diurnal cycle, from 29.5 Earth days (for the Moon) to 1 day, we get (obviously) a greatly reduced diurnal range in temperature (22 deg. C diurnal range, global average, versus 209 deg. C diurnal range for the Moon), and a global average surface temperature of 267 K. and:
“If I use a lunar albedo for the Earth, then the GHE becomes only 21 deg. C with the new calculations”.
(Author’s note: GHE stands for greenhouse effect. For the purpose of this report, we will take the 21K for the greenhouse effect as being correct)
It seems logical to me to use the lunar albedo of 0.10 instead of the 0.30 as there are no clouds. It is seen from the results of all our estimates and investigations that earth without water and greenhouse gases (GHG) could be 267K rather than 255K (the term GHG is meant to include water and water vapor).
What is the actual effect of more carbon dioxide in the atmosphere?
The report that provided the ‘proof’ that more CO2 causes more warming originally came from Svante Arrhenius. But his initial results for extra heat for a doubling of [CO2] were far too high. He corrected this somewhat at a later stage and it was further changed and adapted by successive climate scientists.
I quote from Wikipedia:
“Arrhenius refers to CO2 as carbonic acid (which refers only to the aqueous form H2CO3 in modern usage). The following formulation of ‘Arrhenius’s rule’ is still in use today:
dF =α*ln ([CO2] / [CO2 ]pre) (2)
where: dF = the increase in rate of heating Earth’s surface (radiative forcing) in Watts per m2 = W/m2
where: [CO2 ]pre = the CO2 concentration at the beginning of the industrial time, usually 1850 when the [CO2] was 280 ppm
where: ln is the natural logarithm and
where: a = alpha, is derived from atmospheric radiative transfer models and is 5.35 (± 10%) W/m2 for Earth’s atmosphere.
[37]End quote.
This equation (2) was apparently also reported in AR5 from the IPCC. I found that the origin of formula (2) must be from Myhre et al (1998) (click on the link, see Table 3 in the report). Hansen et al (1998) and Shi (1992) apparently reported similar results. When I went through the above linked report by Myhre et al, I noticed that the key words being used are: ‘Estimates’, ‘calculations’ and ‘models’. It is not clear to me how the formula was deduced. My question is: what did they measure, exactly? Nevertheless, let us assume for the purpose of this investigation that equation (2) is correct. For a doubling of the carbon dioxide to 560 from 280 ppmv in 1850, we calculate:
5.35 * ln (560/280) =3.7 W/m2.
The current CO2 concentration is 425 ppmv, so we calculate an extra forcing due to the extra carbon dioxide (CO2) of:
5.35* ln (425/280) = 2.2 W/m2.
My argument is that the S-B equation must be applicable to show how the temperature is affected. Let us first see what the temperature becomes when we add 3.7 W/m2 to the given value in equation (1) for S = 238.7. By substitution of 238.7 with 242.4 we re-calculate the temperature at 255.7K. So, for a doubling of CO2 we see an increase in the temperature of earth by 255.7-254.7=1.0K or degree C. For the current date (3/5/2025) we add the 2.2 to 238,7 and we substitute 240,9 for the 238,7. We now calculate a temperature of 255.3K This result suggests a delta T of 255.3-254.7= 0.6K or degree C due to the extra carbon dioxide (CO2) from 1850 up to now.
Errors
The problem is that, as we had seen in our initial investigations, the S-B equation (1) gives the wrong answer for the temperature of earth without water and GHG, when it should be 267K instead of 254.7. So the given values used are incorrect. What are some of the possible errors?
1) In the S-B equation it was accepted that the emissivity e of earth is 1.00. From various sources I found that the emissivity of snow and ice (ca.12%) is 0.975; the emissivity of water (ca. 60%) is 0.955; and the emissivity of sand and leaf foliage (ca.28%) are 0.90 and 0.98 respectively. I conclude that the average emissivity of earth is not less than 0.95. Therefore, for this investigation, I will now use e=0.95
2) Few climate scientists give serious attention to the idea that there is also significant radiation coming from the planet itself, e.g. from its core and due to volcanic activity, especially underneath the oceans. I refer to a number of reports from different writers who disagree with the ‘consensus’:
-
https://breadonthewater.co.za/2023/07/20/geology-versus-climate-change/
-
https://breadonthewater.co.za/2022/08/02/global-warming-how-and-where/
-
https://breadonthewater.co.za/2025/02/02/what-drives-el-ninos/
- Volcanoes Spew 3X More CO2 Than Thought & 19,000 New Undersea Volcanoes Found: Is Human-Driven Climate Narrative Crumbling? – Watts Up With That?
Think of yourself inside a box, like a boiler, with heat coming from the bottom and the top. It can be proven that the warming of the arctic waters, (and the corridor to Iceland), the warming of the Mediterranean- and the Black Sea and the obvious warming of the land surrounding these waters are all directly related to volcanic activity on the bottom of the seas and that this activity has been increasing in recent decennia. There is ample evidence suggesting that El Ninos have their origin in or near the Ring of Fire in the Pacific.
Some publications indicate that the upwelling warmth from earth itself is only 0.9 W/m2, on average. Possibly this takes not into account the effect of (more) volcanic activity taking place underneath the seas and oceans, when it is presumed that all the warming of the ocean is due to the sun and/or more GHG. Reportedly, there is lack of adequate measuring units to monitor changes of temperatures of certain areas in the oceans due to local volcanic activity.
3) A large part of the error of the 267-255 = 12K or 12 degrees C concerns the amount of sunlight being absorbed by earth. An albedo of 0.3 (i.e. 30% reflected to space) is often reported as a given but exactly which wavelengths does this 30% represent? I cannot find any papers on that. Remember that only UV- and IR light can heat up water. In addition, a search on the internet revealed that the albedo of water is only 0.03 (60% of surface). Snow & ice have a range from 0.7 to 0.9. Let us accept 0.8 (12% of surface). Sand has an albedo 0.1 and forests 0.15 (28%). From these values I calculate a total albedo of ca. 0.15. However, this excludes clouds, of course. Wikipedia indicates that clouds are responsible for as much as 50% of earth’s albedo. Problem: this is again given as a single result. We donot know how cloud levels can vary. I remember from earlier textbooks that a value of 25% was often given for the radiation (energy) from the sun not reaching earth at sea level suggesting a real albedo of 0.25.
Whichever way you look at it, the finding here must be that the 238.7 W/m2 that we had used for S (as found in most textbooks) is suspect if the value of 267K for temperature on a planet without GHG must be the outcome. When we apply the S-B equation (1) for a planet at the given temperature of 267K and e=0.95 we find:
S = 0.95*5.67*10-8*(267)4 = 273.7 W/m2.
How would this result affect the delta T as a result of the alleged extra forcing due to more CO2?
For a doubling of [CO2] in the air: 273.7 + 3.7 = 277.4 W/m2
= 0.95*5.67 x 10-8*T4
from where it follows that T = 267.9, delta T = 0.9K = 0.9C
For the current [CO2] in the air: 273.7 + 2.2 = 275.9 W/m2
= 0.95*5.67*10-8*T4
from where it follows that T = 267.5, so delta T = 0.5K = 0.5C.
Conclusion
If the values given for the ‘estimates’ used by AR5 (IPCC), Myhre et al (1998), Hansen (1998) and Shi (1992) for the additional forcing due to more carbon dioxide (CO2) are correct (equation 2), we see a small decrease in the global warming from 0.6 to 0.5K or degree C, due to the extra CO2, given that the average temperature of earth without water and GHG, is 267K rather than 255K. So, the worst possible scenario is that the extra CO2 in the atmosphere since 1850 is responsible for only 0.5K or degree C of the total GHE of ca. 21K or degree C.
Discussion
Firstly, note that some climate scientists will claim that the actual warming effect of CO2 is much higher due to the so-called ‘water feedback’ effect. In other words, when it gets warmer, you will get more water vapor, and this will double or more the CO2 warming effect. However, this argument does not seem to hold water (no pun intended) since the global relative humidity apparently has been going down for quite some time (see my comments below). This is in line with what I think could be expected from the decrease in the average Tmax (global) due to the cooler period of the Gleissberg solar cycle.
I mention a few skeptical scientists who also looked at the problem of the effect of more CO2 in the air:
Antero Ollila. See:
https://www.climatexam.com/single-post/2015/01/27/What-is-the-real-radiative-forcing-value-of-CO2
He did an independent analysis of the IR spectrum in the range 10-20 um where earth emits and came to the following formula:
dF = 3.12* ln ([CO2]/[CO2]pre).
This means an additional forcing of only 1.3 W/m2 for the current concentration of CO2 in the air.
This adds up to 275.0 W/m2
= 0.95*5.67*10-8*T4 from where it follows that T = 267.3, so delta T = 0.3K = 0.3 degree C.
The author, Henry Pool. See:
An evaluation of the greenhouse effect by carbon dioxide | Bread on the water
I did a step-by-step analysis over the whole IR spectrum of CO2 from 0-25 um, except for the absorption of CO2 in the UV. I find that the net effect of more CO2 is about zero as the energy of the back radiation to the sun and space appears to cancel out the back radiation of CO2 to earth. At the end of my report, I mention more investigations from scientists who concluded that the effect of more CO2 in the atmosphere is nothing, or next to nothing.
Finally, the allegation that man is responsible for all of the 425-280 =145 ppmv extra CO2 since 1850 is most probably also wrong. Indications from Dr. Ollila are that man is responsible for about 7-10% of this amount. The rest is mostly coming from more CO2 gassing out due to the higher temperature of the oceans. Think of taking a soda out of the fridge, opening it and leaving it to stand. How long does it take for the soda to lose its fizz (=CO2)? I refer for this also to the work by the late prof. Ennersbee:
The mystery of the missing human-generated carbon dioxide | Bread on the water
See graph from Prof. Ennersbee below. The extra warmth of the oceans is most probably due to increased volcanic activity below the ocean- and sea floor.

For the trend in humidity, see: https://static.wixstatic.com/media/c266e2_7bffd6c4ff024b31aa70703d8e4cd642~mv2.jpg/v1/fill/w_483,h_363,al_c,q_80,usm_0.66_1.00_0.01,enc_auto/c266e2_7bffd6c4ff024b31aa70703d8e4cd642~mv2.jpg
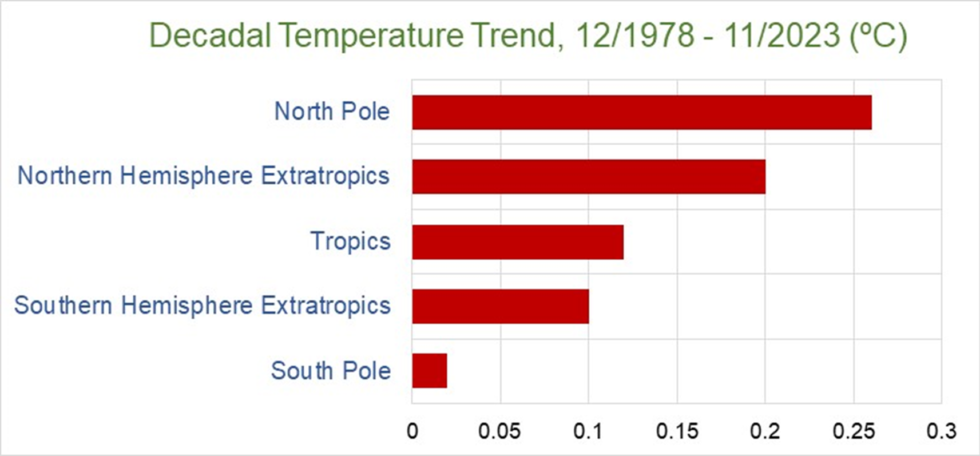
The first graph used in this post shows that the warming trend on earth is not ‘global’ Yet this is what you would expect if there is warming due to more carbon dioxide in the atmosphere as it behaves like an ideal gas and therefore the rate of increase in CO2 in the air is everywhere almost the same. Yet the observed warming seems to spread from north to south.
Note there is hardly any warming trend in South Africa, on average. The warming that is observed at a few local places, is clearly due to the urban heat effect:
https://breadonthewater.co.za/2024/05/28/no-change-in-temperature-in-south-africa-for-more-than-45-years/
This despite the fact that a bit more CO2 (from the ocean’s outgassing) seems to linger a bit longer above Brazil and South-Africa due to the wind.
https://static.wixstatic.com/media/c266e2_5780f25a56464c5892bab9eefe4e7692~mv2.jpg/v1/fill/w_541,h_406,al_c,q_80,usm_0.66_1.00_0.01,enc_auto/c266e2_5780f25a56464c5892bab9eefe4e7692~mv2.jpg
The issue of the human part in the extra CO2 in the air, is shown in slide:
https://static.wixstatic.com/media/c266e2_0c869f2321f34dea89af6ab8cef0608f~mv2.jpg/v1/fill/w_541,h_406,al_c,q_80,usm_0.66_1.00_0.01,enc_auto/c266e2_0c869f2321f34dea89af6ab8cef0608f~mv2.jpg
Very interesting discussion, thanks.
Hi Andy
You got me started on this after me reading your excellent report! I was still surprised that the shrinking of the total gh/ water effect by 12K did not really affect the influence of CO2 that much.
You follow the right idea, though with a number of mistakes.
1. The dark side of the moon is not -133°C, but more like -180°C, even at the equator. That NASA quote of -133°C is pointless and to be understood as a transitional ballpark figure just after the sun is gone.
2. May’s approach is not much better, stuck in unnecessary assumptions.
3. You misinterpret the 3.7W/m2 2xCO2 consensus forcing figure. This is NOT a delta TOA, but the sum of “fluxes” at the tropopause, with about 2.4W/m2 less upwelling and 1.3W/m2 more downwelling radiation. The delta TOA is indeed just 2W/m2 for a doubling of CO2.
4. Surface emissivity is indeed below 0.95. Water has a hemispheric spectral emissivity of just 0.91(!!!).
There is a far more consistent way to discuss this.
First we know the emissivity and the reflectivity of water (0.06), covering 70% of the planet. Using the SB law we calculate: (0.94/0.91 * 342/5.67e-8)^0.25 = 281K. While we lack consistent data for land, the overall result should not differ too much from this, like ~280K. The “net GHE” so to say is only about 7-8K.
The 33K GHE however is only a theoretical view on the emission side, with energy budget and lapse rate taken as given. Even so it is a bit off, as it does not account for surface emissivity. As the surface is not a perfect emitter, its emissions are not ~395W/m2, but only ~360W/m2. The (gross) GHE thus should amount to ~120W/m2 (not 155W/m2), or ~27K respectively.
The two biggest GH-agents (clouds and WV) have massive impacts on the named constraints. Clouds reduce the energy budget by about 50W/m2, WV on the other hand reduces the lapse rate from a ~10.8K/km dry unstable adiabat to a mere 6.5K/km. The lapse rate of course is key to the size of the GHE, because it defines the delta between Ts and Te (emission temperature).
Let us do a simple calculation. Non-condensing GHGs (CO2, CH4, O3..) provide a gross GHE of about 45W/m2. With a dry adiabat of 10.8K/km that would grow to 10.8/6.5 * 45 = ~70W/m2+. They then would reduce emissions to 290W/m2 (=360-70). Without clouds the energy budget would increase to 290W/m2 (=240+50). In other words, removing water from the atmosphere would result in 290W/m2 IN and 290W/m2 OUT, a balanced budget without a change in temperature.
The atmospheric water does not actually add heat to the system, it is largely climate neutral. Apart from the theoretical perspective that the GHE is, in reality it are only the non-condensing GHGs effectively warming the planet, by about 7-8K, as above.
I need some time to react to this in detail.
@E.Schaffer
1. The dark side of the moon is not ‘dark’. It is just that we cannot see it. The moon rotates 360 degrees on its own axis in about 29 days. I am certain that NASA has left the measuring and recording equipment on a flat surface near the equator and in 29 days it would have gone through a full night and day cycle. The formula that has always been applied to determine the mean at a certain place on earth is (Tmax +Tmin) / 2
So, I am saying that at the equator on the moon the average temperature is -6 degrees C =267K.
2. That is your opinion, but you are not giving a motivation for your opinion.
3. I have never said that the forcing for CO2 comes TOA. It becomes a part of S which is the absorbed energy from the sun by earth and its atmosphere.
4. I reported a certain source which mentioned that the emissivity of water is 0.955. Wikipedia agrees and gives it as 0.96.
https://en.wikipedia.org/wiki/Emissivity
Giving non-condensing gases a credit of 45 W/m2 is simply wrong. I will tell you now which big part of GHE you are missing.
@E. Schaffer
This definition for the GHE was found on the internet somewhere: “it is the capture of the sun’s heat in the lower atmosphere of a planet, because of the greater transparency of the atmosphere for visible radiation from the sun than for infrared radiation emitted from the surface of the planet”.
This definition is misleading because it focusses only on a small aspect of the gh effect. This is not the main reason why a planet with water such as Earth is 21K warmer in the lower regions than a planet without water. I show you schematically how the gh effect really works:
Sunlight (UV/IR) on water => water vapor => water vapor accumulates (sticks together due to strong VanderWaal forces) => cloud formations => there is movement of this moist air and clouds due to pressure- and temperature differentials => clouds and water vapor move to cooler areas => condensation takes place => heat of condensation is released in the air => this is equal to 2260 kJ per kg.
This is the main reason for the gh effect and it shows how heat spreads evenly all over the planet. Don’t forget this. That cold front coming up is really Mother Earth’s way to distribute the heat on our world to an average of about 14 or 15 degrees C. What the definitions in the textbooks want you to believe is that the main reason for the gh effect is that the gh gas slows or captures outgoing long wave radiation from Earth. That is also true, but it is only a very small aspect of the gh effect. Maybe just 5 or 10%?
Harold The Organic Chemist Says:
CO2 Does Not Cause Warming Of The Atmosphere!
Please go to the late John Daly’s website: “Still Waiting For Greenhouse” at:
http://www.John-Daly.com. From the homepage, scroll down to the end and click on “Station Temperature Data” On the “World Map”, click on “NA”, and then scroll down to “USA Pacific”. Finally, scroll down and click on “Death Valley”.
The chart shows plots of temperatures at the Furnace Creek weather station from 1922 to 2001. In 1922 the concentration of CO2 in dry air was 303 ppmv (0.59 g of CO2/cu. m.), and by 2001, it had increased to ca. 371 ppmv (0.73 g of CO2/cu. m.), but there was no corresponding increase in the air temperature at this remote desert. The reason there was no increase in air temperature at this arid desert is quite simple: There is too little CO2 In the air to absorb out-going long wave IR radiation emanating from the desert surface and there was low and constant RH.
John Daly found over 200 weather stations located around the world that showed no warming up to 2002. He used raw temperature data from the GISS and CRU data bases. On the World Map, go to Australia and check out the chart for Adelaide which shows a slight cooling since 1859.
The above empirical temperature data and calculations show that the claims by the IPCC that CO2 causes “global warming” and is the “control knob” for the “climate change” are fabrications and lies. The purpose of these lies is justify the continued maintenance of not only the IPCC but also the UNFCCC and the UN COP.
At the MLO in Hawaii, the concentration of CO2 in dry air is currently 428 ppmv. One cubic meter of this air has a mass of 1.29 kg and contains a mere 0.841g of CO2, an increase of 15% from 2001. This small amount of CO2 can heat up a large mass of air by a very small amount if at all.
Look what these lies about CO2 causing global warming have done the economies of the UK, Germany, California, and Australia. Hopefully, President Trump will have EPA CO2 endangerment finding rescinded and will put end to the greatest scientific fraud since the Piltdown Man.
Henry
Did you ever look at this?
https://sciencepublishinggroup.com/journal/paperinfo?journalid=161&doi=10.11648/j.earth.20170606.18
Very interesting. Let me look at this.