+27 83 629-7690
Re-visiting the 1000-year Eddy cycle

Re-visiting the 1000-year Eddy cycle

I recently read a paper entitled:

‘Evidence for Solar Modulation on the Millennial-Scale Climate Change of Earth’, by Xinhua Zhao, Willie Soon and Victor M. Velasco Herrera (2020). I show the abstract and summary & discussion of the results of the abovementioned study: 

Abstract: we use available reconstructed data to investigate periodicities of solar activity (i.e., sunspot number) and the Earth’s climate change (temperatures of Lake Qinghai in China and Vostok in Antarctica, the GISP δ18O climate record of Greenland, and the stalagmite δ18 O monsoon records of Dongge Cave in China) as well as their cross-wavelet coherences on millennial scale. We find that the variations of the Earth’s climate indices exhibited the 1000-year cyclicity, which was recently discovered in solar activity (called Eddy cycle). The cross-wavelet correlations between the millennium-cycle components of sunspot number and the Earth’s climate change remains both strong and stable during the past 8640 years (BC 6755–AD 1885). The millennial variation of sunspot number keeps in-phase with variations of Lake Qinghai temperature, Greenland temperature, and East Asian Monsoon, but anti-phase with the variation of Antarctica temperature. The strong and stable resonant relationships between sunspot numbers and these climate indices indicate that solar variability may have played a role in modulation on this millennial seesaw pattern of the Earth’s climate change before the modern industrial era. 

The results and graphs of this study can be found here: (1) Evidence for Solar Modulation on the Millennial-Scale Climate Change of Earth

Summary and Discussion: in this paper, we analyzed the reconstructed datasets to probe periodicities and cross-correlations between solar variability (SSN) and climate indices on Earth (summer temperature at Lake Qinghai (TQ ), air temperature at Vostok in Antarctica (TA ), temperature index at Greenland (δ18OG), and Monsoon index at Dongge Cave in China (δ18OD )) during the past 8640 years (BC 6755–AD 1885) before the modern industrial era. We find that the millennial-scale cycle is the only common oscillation between SSN and these climate indices on Earth during our study interval. The millennial-cycle components of SSN and climate indices have both strong and stable correlations. When solar activity is strong (numerous SSN), it will give warming effect on Greenland and Lake Qinghai, a strengthening effect on the monsoon in East Asia, but a cooling effect on Vostok in Antarctica. Conversely, when solar activity is weak (few SSN), it will create a cooling effect on Greenland and Lake Qinghai, a weakening effect on the monsoon in East Asia, but a warming effect on Vostok in Antarctica. These millennial variations account for roughly 10% of the total changes for both solar variability and climate change.

We also find that the climatic response to solar forcing in Vostok of Antarctica is opposite to those in the northern hemisphere (Lake Qinghai, Dongge Cave, Greenland). Similarly, Eroglu et al 2016 discovered a seesaw relationship of the Holocene East Asian-Australian summer monsoon over the last 9000 years at millennial to sub-centennial time-scales, and concluded that solar activity acts as a driver in the seesaw relationship between the East Asian summer monsoon and the Indonesian-Australian summer monsoon by shifting the position of the Intertropical Convergence Zone. The opposite changing trend in the millennial temperatures of two hemispheres had been discovered for 20 years [25–31], which can be termed the “northern-southern hemispheric seesaw”. More and more evidence indicates that this dynamic see-saw pattern seems to be a persistent feature of long-term climate change [27,28]. The complicated oceanic and/or atmospheric processes are thought to be possible explanations for this seesaw phenomenon, and the driving center of action for the millennial-scale seesaw could be initiated from the northern hemisphere [27,32]. In the case with emphasis on the northern hemisphere playing a leading role for millennial-scale oscillation or see-saw, an increase in the North Atlantic thermohaline circulation would warm the high-latitude northern hemisphere, but cool the southern hemisphere on a millennial scale [26,27]. The modeling based on the climate model demonstrated that the millennial variations of the northern temperature keep consistent with the global change, and only a small part of the very southern regions presents a converse trend with the global variation [29]. Therefore, we can give the following scenario: solar activity first generates positive feedback on the global Earth. For example, solar irradiance as well as geomagnetic storms produced by solar activities can have effects on the Earth’s atmosphere [33–35]. The positive feedback in the ocean-atmosphere system can also amplify the response to solar irradiance variations [36,37]. Then this global change will lead to negative feedback in the local Antarctic through complex oceanic and/or atmospheric processes. However, it is important to note that our study here is only based on data from four places on Earth. For future steps, we need to find more evidence from different places all over the world to verify this ‘north-south’ seesaw pattern as well as more credible physical mechanisms accounting for the seesaw oscillations between climate indices in the northern and southern hemisphere. 

End quote from the paper.

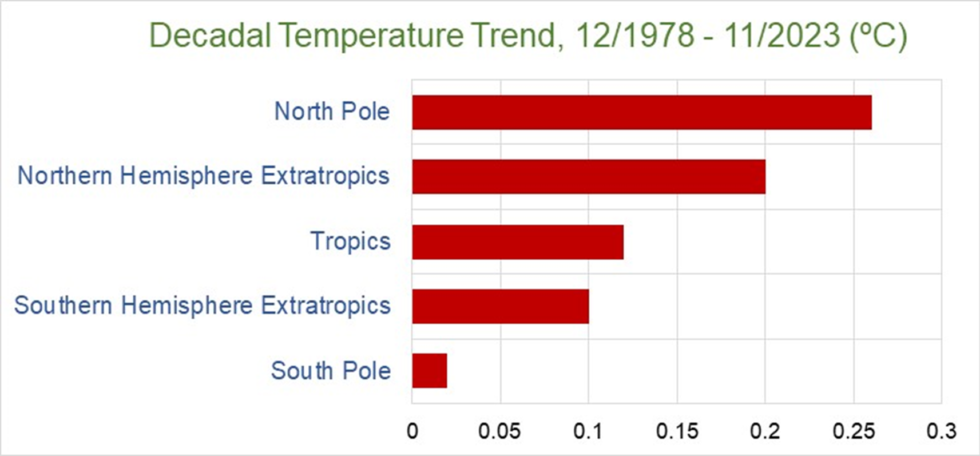
Some of you will remember that I did write an article on the 1000-year Eddy cycle before, in 2021. See footnote 1 below. I was curious to find out if Dr. Willie Soon would respond to my question if the current warming of earth could be due mostly to the Eddy cycle as suggested by the graph depicted at the start of this post. I was indeed pleased and surprised to receive a quick response. He writes: ‘Many thanks for sharing your thoughts on the Eddy cycle…..the graph you used in your link is indeed correct. But I am sure you are aware that the realities are a bit more complex.’ He recommends that we watch the video where he mentions that the global temperature record is contaminated as we measure the temperature where we know it becomes warmer due to the increase in buildings, pavements and asphalt that we put around us. It also appears that the record for the variance in solar irradiance (parameters & data) has apparently been cherry picked by the IPCC. The video only takes about 15 minutes to watch. 

We conclude from this paper & video:

1) There is undeniable evidence for a millennial solar/weather cycle, called the Eddy cycle, and that, indeed, we are approaching the top of the wave, experiencing more warming, just like it was a thousand years ago. There are numerous reports and papers confirming this. See the footnotes in footnote 1.

2) The seesaw pattern that was observed with warming moving in opposite directions of the hemispheres, as described in the paper, is in fact a perfect explanation for the results of my own statistical analysis in 2015 of 27 weather stations NH and 27 weather stations SH, showing little or no warming in the SH compared to significant warming in the NH. See Table 1, footnote 2.

3) In the video, Dr. Soon shows the results of a study of the warming in the USA where it was found that the effect of the Urban Heat Island (UHI) is considerable, namely 1.11K per century compared to 0.62K per century for non-urban areas. This is almost 80% (1.11-0.62 /0.62 x 100%) more. In my own latest statistical analysis of 11 weather stations here in South-Africa, I also noticed some significant warming in Johannesburg, Cape Town and East-London. compared to next-to-nothing elsewhere. In this case I also mentioned that the only reason to explain this, is the UHI effect, as these are the three cities that increased considerably, both in size and population. For all results in South Africa, see footnote 3

4) The results of this investigation here do not negate the probability that volcanic activity could play a role in the extra warming of earth that is being observed, during the Eddy cycle, especially in the NH. See footnote 4) and 5). In fact, a slight change in the position of earth’s inner core, due to some or other re-alignment with the magnetic field of the sun (magnetic stirrer effect), could help explain the difference in the phase of warming that is being observed between the two hemispheres.

5) Finally, I want to mention here that I think there is at least one major contributory factor to the warming that no one has investigated as far as yet, and it is a bit similar to the UHI effect. For example, I have noticed that the temperature of the water in the rivers ending up in the North Sea all seem to have increased at about the same rate as the water of the North Sea itself. Also, at the big nuclear energy power station here in Koeberg, we observed some fish were disappearing. Eventually it was found that this was due to the surrounding ocean water becoming warmer. These observations seem to support the argument that more and more water being used by industry for cooling purposes could have a serious warming effect, due to the increase in vapor pressure. 

Evidence is mounting now that the extra little bit of carbon dioxide in the atmosphere caused by the burning of fossil fuels is not the cause or main cause of the extra warming…. See footnote 6.

FOOTNOTES

1) 

The 1000-year Eddy cycle | Bread on the water

De duizendjarige Eddy-cyclus – Climategate Klimaat

2)

An Inconvenient Truth | Bread on the water

Een ongemakkelijke waarheid – Climategate Klimaat

3)

No change in temperature in South Africa for more than 45 years! | Bread on the water

Al meer dan 45 jaar geen temperatuurverandering in Zuid-Afrika! – Climategate Klimaat

4)

https://www.climategate.nl/2022/08/mondiale-opwarming-hoe-en-waar/

Oppervlakteluchttemperatuur (SAT) versus zeeoppervlaktetemperatuur (SST) – Climategate Klimaat

5) 

What drives El Ninos? | Bread on the water

Waar komen El Niños eigenlijk vandaan? – Climategate Klimaat

6)

168 scientific papers showing that the effect of more carbon dioxide in the air is nothing or next to nothing… | Bread on the water

Scientists calculate when the universe will come to an end….

Scientists calculate when the universe will come to an end….

Ja. Ja. Eventually, when our lives are over, everything goes back into the box. I thought so. It does not matter how long it will take, because just like you did not experience the time that passed before your birth, you will also not experience the time after your death. That is why Jesus said to the criminal hanging next to him: today you will be with me in paradise!!

As the story of our cosmos moves forward, stars will slowly burn out, planets will freeze over, and black holes will devour light itself. Eventually, on timescales so long humanity will never witness them, the universe will fade into darkness. But if you’ve ever wondered exactly when it all might end, you may find it oddly comforting, or perhaps a bit unsettling, to know that someone has actually done the math. As it turns out, this cosmic finale might arrive sooner than scientists previously thought.

Don’t worry, though — “sooner” still means a mind-bending 10 to the power of 78 years from now. That is a 1 followed by 78 zeros, which is unimaginably far into the future. However, in cosmic terms, this estimate is a dramatic advancement from the previous prediction of 10 to the power of 1,100 years, made by Falcke and his team in 2023.

Source:  https://www.space.com/astronomy/scientists-calculate-when-the-universe-will-end-its-sooner-than-expected

An evaluation of the greenhouse effect by carbon dioxide (2)

An evaluation of the greenhouse effect by carbon dioxide (2)

Note that this post has been superseded with this one:

An evaluation of the green-house effect by carbon-dioxide (3) | Bread on the water

In hindsight, I should say that if we strictly were to compare actual measurements done at the surface of the moon near the equator (Tmean= -6C, see report below) and we compare this with actual measurements done on earth near the equator (Tmean= 27C, see link below), we still see an absolute difference of [33] K.

https://breadonthewater.co.za/wp-content/uploads/2024/12/Hato-Curacoa.jpg

What is the temperature of earth, on average?

Based on real measurements of temperature at measuring stations not far from the ground, the global average temperature on earth is estimated at 15 degrees C. This is 288K. However, there are many areas such as Greenland, the polar regions, the Sahara and other large deserts where no people live. Therefore, there are very few or no measuring stations in these places. Nevertheless, for the purpose of our investigation we decide to ignore this and accept that the average temperature on earth is about 288K.

What would the temperature be like if there were no water and greenhouse gases?

This is derived from Stefan-Boltzmann’s (S-B) law:

S = e*σ*T4    (1)

where: S is the amount of sunlight being absorbed by the surface in W/m2, on average. This takes the solar constant divided by 4 (to spread it evenly over both latitudes and the day and night cycle) and then accounts for 30% of light being reflected into space,

i.e. 1364/4 *0.70 =238.7 W/m2

where: e is emissivity of an object, generally set to 1.00 for an ideal radiator.

where: σ  = 5.670*10-8 = the Stefan-Boltzmann constant

where: T is the temperature in Kelvin.

With the values given, the calculation is:

238.7=1.00 * 5.67 * 10-8 * T4 and this ends up with T= 254.7K, that is -18C.

The difference between 288 and 255 is 33K or 33 degrees C. This is indeed what most school textbooks are reporting as being the result of the so-called greenhouse effect.

I became interested in finding out if this 255K result is correct. I thought it would be best to look at the moon. According to NASA, (click on the link) the maximum temperature near the equator during the (lunar) day is + 121C and during the (lunar) night the minimum gets to – 133C. A lunar day and night together are 29.5 earth days. The rotation is so slow that we never see the ‘dark’ side of the moon. Roughly speaking then, I estimate the average temperature on the moon (121 + -133)  /2 = -6 degrees C, or 267K. (With my back-of-the-envelope method, the length of the day and night does not really matter). So, 267K was my first rough estimate of the temperature of earth without water and an atmosphere. To compare, we can look at the more comprehensive reasoning and calculations by Andy May:

The Earth without Greenhouse Gases – Andy May Petrophysicist

Andy May came to an average of -8C. This is 265K.

Furthermore, in his post,

Errors in Estimating Earth’s No-Atmosphere Average Temperature « Roy Spencer, PhD

Roy Spencer writes:

“If I repeat the model calculations in Fig. 2 and only change the length of the diurnal cycle, from 29.5 Earth days (for the Moon) to 1 day, we get (obviously) a greatly reduced diurnal range in temperature (22 deg. C diurnal range, global average, versus 209 deg. C diurnal range for the Moon), and a global average surface temperature of 267 K. and:

“If I use a lunar albedo for the Earth, then the GHE becomes only 21 deg. C with the new calculations”.

(Author’s note: GHE stands for greenhouse effect. For the purpose of this report, we will take the 21K for the greenhouse effect as being correct)

It seems logical to me to use the lunar albedo of 0.10 instead of the 0.30 as there are no clouds. It is seen from the results of all our estimates and investigations that earth without water and greenhouse gases (GHG) could be 267K rather than 255K (the term GHG is meant to include water and water vapor).

What is the actual effect of more carbon dioxide in the atmosphere?

The report that provided the ‘proof’ that more CO2 causes more warming originally came from Svante Arrhenius. But his initial results for extra heat for a doubling of [CO2] were far too high. He corrected this somewhat at a later stage and it was further changed and adapted by successive climate scientists.

I quote from Wikipedia:

“Arrhenius refers to CO2 as carbonic acid (which refers only to the aqueous form H2CO3 in modern usage). The following formulation of ‘Arrhenius’s rule’ is still in use today:

dF =α*ln ([CO2] / [CO2 ]pre)    (2)

where: dF = the increase in rate of heating Earth’s surface (radiative forcing) in Watts per m2 = W/m2

where: [CO2 ]pre = the CO2 concentration at the beginning of the industrial time, usually 1850 when the [CO2] was 280 ppm

where:  ln is the natural logarithm and

where: a = alpha, is derived from atmospheric radiative transfer models and is 5.35 (± 10%) W/m2 for Earth’s atmosphere.

[37]End quote.

This equation (2) was apparently also reported in AR5 from the IPCC. I found that the origin of formula (2) must be from Myhre et al (1998) (click on the link, see Table 3 in the report). Hansen et al (1998) and Shi (1992) apparently reported similar results. When I went through the above linked report by Myhre et al, I noticed that the key words being used are: ‘Estimates’, ‘calculations’ and ‘models’. It is not clear to me how the formula was deduced. My question is: what did they measure, exactly? Nevertheless, let us assume for the purpose of this investigation that equation (2) is correct. For a doubling of the carbon dioxide to 560 from 280 ppmv in 1850, we calculate:

5.35 * ln (560/280) =3.7 W/m2.

The current CO2 concentration is 425 ppmv, so we calculate an extra forcing due to the extra carbon dioxide (CO2) of:

5.35* ln (425/280) = 2.2 W/m2.

My argument is that the S-B equation must be applicable to show how the temperature is affected. Let us first see what the temperature becomes when we add 3.7 W/m2 to the given value in equation (1) for S = 238.7. By substitution of 238.7 with 242.4 we re-calculate the temperature at 255.7K. So, for a doubling of CO2 we see an increase in the temperature of earth by 255.7-254.7=1.0K or degree C. For the current date (3/5/2025) we add the 2.2 to 238,7 and we substitute 240,9 for the 238,7. We now calculate a temperature of 255.3K This result suggests a delta T of 255.3-254.7= 0.6K or degree C due to the extra carbon dioxide (CO2) from 1850 up to now.

Errors

The problem is that, as we had seen in our initial investigations, the S-B equation (1) gives the wrong answer for the temperature of earth without water and GHG, when it should be 267K instead of 254.7. So the given values used are incorrect. What are some of the possible errors?

1) In the S-B equation it was accepted that the emissivity e of earth is 1.00. From various sources I found that the emissivity of snow and ice (ca.12%) is 0.975; the emissivity of water (ca. 60%) is 0.955; and the emissivity of sand and leaf foliage (ca.28%) are 0.90 and 0.98 respectively. I conclude that the average emissivity of earth is not less than 0.95. Therefore, for this investigation, I will now use e=0.95

2) Few climate scientists give serious attention to the idea that there is also significant radiation coming from the planet itself, e.g. from its core and due to volcanic activity, especially underneath the oceans. I refer to a number of reports from different writers who disagree with the ‘consensus’:

Think of yourself inside a box, like a boiler, with heat coming from the bottom and the top. It can be proven that the warming of the arctic waters, (and the corridor to Iceland), the warming of the Mediterranean- and the Black Sea and the obvious warming of the land surrounding these waters are all directly related to volcanic activity on the bottom of the seas and that this activity has been increasing in recent decennia. There is ample evidence suggesting that El Ninos have their origin in or near the Ring of Fire in the Pacific.

Some publications indicate that the upwelling warmth from earth itself is only 0.9 W/m2, on average. Possibly this takes not into account the effect of (more) volcanic activity taking place underneath the seas and oceans, when it is presumed that all the warming of the ocean is due to the sun and/or more GHG. Reportedly, there is lack of adequate measuring units to monitor changes of temperatures of certain areas in the oceans due to local volcanic activity.

3) A large part of the error of the 267-255 = 12K or 12 degrees C concerns the amount of sunlight being absorbed by earth. An albedo of 0.3 (i.e. 30% reflected to space) is often reported as a given but exactly which wavelengths does this 30% represent? I cannot find any papers on that. Remember that only UV- and IR light can heat up water. In addition, a search on the internet revealed that the albedo of water is only 0.03 (60% of surface). Snow & ice have a range from 0.7 to 0.9. Let us accept 0.8 (12% of surface). Sand has an albedo 0.1 and forests 0.15 (28%). From these values I calculate a total albedo of ca. 0.15. However, this excludes clouds, of course. Wikipedia indicates that clouds are responsible for as much as 50% of earth’s albedo. Problem: this is again given as a single result. We donot know how cloud levels can vary. I remember from earlier textbooks that a value of 25% was often given for the radiation (energy) from the sun not reaching earth at sea level suggesting a real albedo of 0.25.

Whichever way you look at it, the finding here must be that the 238.7 W/m2 that we had used for S (as found in most textbooks) is suspect if the value of 267K for temperature on a planet without GHG must be the outcome.  When we apply the S-B equation (1) for a planet at the given temperature of 267K and e=0.95 we find:

S = 0.95*5.67*10-8*(267)4 = 273.7 W/m2.

How would this result affect the delta T as a result of the alleged extra forcing due to more CO2?

For a doubling of [CO2] in the air: 273.7 + 3.7 = 277.4 W/m2

= 0.95*5.67 x 10-8*T4

from where it follows that T = 267.9, delta T = 0.9K = 0.9C

For the current  [CO2] in the air: 273.7 + 2.2 = 275.9 W/m2


= 0.95*5.67*10-8*T4

from where it follows that T = 267.5, so delta T = 0.5K = 0.5C.

Conclusion

If the values given for the ‘estimates’ used by AR5 (IPCC), Myhre et al (1998), Hansen (1998) and Shi (1992) for the additional forcing due to more carbon dioxide (CO2) are correct (equation 2), we see a small decrease in the global warming from 0.6 to 0.5K or degree C, due to the extra CO2, given that the average temperature of earth without water and GHG, is 267K rather than 255K. So, the worst possible scenario is that the extra CO2 in the atmosphere since 1850 is responsible for only 0.5K or degree C of the total GHE of ca. 21K or degree C.

Discussion

Firstly, note that some climate scientists will claim that the actual warming effect of CO2 is much higher due to the so-called ‘water feedback’ effect. In other words, when it gets warmer, you will get more water vapor, and this will double or more the CO2 warming effect. However, this argument does not seem to hold water (no pun intended) since the global relative humidity apparently has been going down for quite some time (see my comments below). This is in line with what I think could be expected from the decrease in the average Tmax (global) due to the cooler period of the Gleissberg solar cycle.

I mention a few skeptical scientists who also looked at the problem of the effect of more CO2 in the air:

Antero Ollila. See:

https://www.climatexam.com/single-post/2015/01/27/What-is-the-real-radiative-forcing-value-of-CO2

He did an independent analysis of the IR spectrum in the range 10-20 um where earth emits and came to the following formula:

dF = 3.12* ln ([CO2]/[CO2]pre).

This means an additional forcing of only 1.3 W/m2 for the current concentration of CO2 in the air.

This adds up to 275.0 W/m2


= 0.95*5.67*10-8*T4  from where it follows that T = 267.3, so delta T = 0.3K = 0.3 degree C.

The author, Henry Pool. See:

An evaluation of the greenhouse effect by carbon dioxide | Bread on the water

I did a step-by-step analysis over the whole IR spectrum of CO2 from 0-25 um, except for the absorption of CO2 in the UV. I find that the net effect of more CO2 is about zero as the energy of the back radiation to the sun and space appears to cancel out the back radiation of CO2 to earth. At the end of my report, I mention more investigations from scientists who concluded that the effect of more CO2 in the atmosphere is nothing, or next to nothing.

Finally, the allegation that man is responsible for all of the 425-280 =145 ppmv extra CO2 since 1850 is most probably also wrong. Indications from Dr. Ollila are that man is responsible for about 7-10% of this amount. The rest is mostly coming from more CO2 gassing out due to the higher temperature of the oceans. Think of taking a soda out of the fridge, opening it and leaving it to stand. How long does it take for the soda to lose its fizz (=CO2)? I refer for this also to the work by the late prof. Ennersbee:

The mystery of the missing human-generated carbon dioxide | Bread on the water


See graph from Prof. Ennersbee below. The extra warmth of the oceans is most probably due to increased volcanic activity below the ocean- and sea floor.