

The incomplete definition:
I first explain in simple language how the greenhouse effect works. It is important that everyone who has anything to do with this effect at least understands what is happening. This definition was found on the internet somewhere: “it is the capture of the sun’s heat in the lower atmosphere of a planet, because of the greater transparency of the atmosphere for visible radiation from the sun than for infrared radiation emitted from the surface of the planet”. This definition is misleading because it focuses only on a small aspect of the greenhouse effect. This is not the main reason why a planet with water such as Earth is 33 K warmer in the lower regions than a planet without water. Below I show you how the greenhouse effect really works:
- Sunlight (mainly UV/IR) absorbed by the earth’s surface (about 70% covered by water) => evaporation
- Water vapor accumulates (intermolecular & Van der Waals forces) and, when the air cools sufficiently, condenses around condensation nuclei = > clouds
- There is movement of moist air and clouds due to pressure- and temperature differences = > clouds and water vapor move to cooler areas
- Condensation takes place = > heat of condensation is released in the air
- The heat of condensation is equal to 2260 kJ per kg.
The above process is the principal mechanism of the greenhouse effect, because it explains how thermal energy is redistributed across the planet. Atmospheric systems such as cold fronts illustrate this redistribution: they transport heat and moisture from warmer regions to cooler regions and thereby contribute to maintaining Earth’s average surface temperature at approximately 14–15°C.
Standard textbook definitions now commonly attribute the whole greenhouse effect primarily to the absorption and delayed emission of outgoing longwave radiation by greenhouse gases. In my assessment, however, that represents only a limited component of the overall process—perhaps 5%, or possibly even less. A rigorous quantitative treatment of this contribution appears to be largely absent from conventional explanations…
Where I live, I have also noticed that when clouds appear during the day, the maximum temperature drops by at least 5 degrees C. When clouds appear at night, I find the minimum temperature only increases by about 3-4 degrees C. These observations would generally support the argument that the occurrence of less clouds causes more warming on earth. The proposed theory is that due to less irradiation by cosmic radiation – for whatever natural reason – and/or due to cleaner air in general, the formation of the condensing nuclei needed to form clouds is somewhat less. Again, it appears that the quantification of this effect is being ignored.
Note that the altitude dependence of the temperature (pictured above) appears to be at least as important as the whole greenhouse effect of ca. 33 K…..
The wrong process:
Most atmospheric gases, including nitrogen and oxygen, that make up for about 99% of the atmosphere, allow almost all radiation with wavelengths of 0–25 µm from both the Sun and Earth to pass through unhindered. By contrast, greenhouse gases such as water vapor, carbon dioxide (CO2), methane, nitrous oxide, ozone, and a few others absorb radiation in specific regions of the infrared spectrum, reducing the transmittance of light at those wavelengths. For simplicity, our discussion focuses on CO2, because it is produced by burning fossil fuels which is the focus of the climate debate. To illustrate, the infrared spectrum of CO2 is shown below:

Fig. 1
We notice that CO2 absorbs at certain wavelengths: most prominently around 4.26 μm and 15 μm. The lesson that we and most students get taught is that when this infrared radiation is absorbed, the CO2 molecule vibrates. Through collisions with oxygen and/or nitrogen molecules, the vibrations are transported to these molecules. Within these molecules, the vibrations are converted into heat, and this is the heat that is supposedly released by the influence of CO2. The common argument is that the continued exposure of light with, say, wavelength 15 μm from both earth and sun, is absorbed, and this absorbed radiation is continuously converted to heat during the interaction and numerous collisions with other gas molecules….
Some observations, related to water, water vapor and water droplets, appear to support this theory. Fine! We know that water has absorption in the UV- and the IR regions and that this is converted into heat. Hence the burning of your skin after exposure to UV and evaporation of water from the top layers of water (oceans). This absorbed heat, spread evenly over the planet by the water of the oceans and water vapor and clouds, sustains our lives on Earth. The point is that with water, there is mass, even if it is just a tiny little drop. The question is whether we can simply assume that the observed effects of absorption of radiation by liquids, namely the appearance of heat, must be the same as with ideal gases.
Since regular measurements of CO2 began, ca. 60 years ago, about 100 ppm of CO2 were added to the atmosphere, from whatever: source
Every extra molecule of CO2 is surrounded by 10000 other gas molecules. CO2 behaves approximately as an ideal gas, meaning there is no sticking together of molecules like we have with water vapor. It diffuses equally into all directions of a vessel. There is also no release of heat due to condensation by CO2. At the pressures and temperatures normally found in the lower atmosphere, CO2 does not condense into a liquid. According to the relevant gas law, there can be no accumulation of that gas in the lower atmosphere, and subsequent condensation, to contribute to the greenhouse effect caused by the water on the planet. In my opinion, one molecule in 10000 has no mass to absorb any heat and pass it on. Any such effect is probably minimal, totally unmeasurable and negligibly small.
So, what does happen to an ideal gas that is irradiated and has absorption in its IR spectrum? Carefully look at Fig. 1. There is no transmission of light with wavelength 4.26 and 15 μm through the molecule. Exposure to specific radiation of that wavelength will not pass through. The proposed theory is that the photons here are re-emitted or re-radiated. Let us call it back-radiation.
This back-radiation by certain substances at certain wavelengths is also the principle of infrared and UV & visible spectrophotometry. I remember that as a student I sometimes secretly lifted the cuvette holder a bit during a determination to see what happens when you turn the wavelength knob on the absorbing wavelength when measuring the standard solutions. I could see that the path of light is obstructed. The light goes back, mostly in the direction of the source, but also a bit round. That is why in my days we used to talk about ‘extinction’. The light does not go through the cuvette, but it goes extinct at the absorbing wavelength. The transmission of the radiation at that wavelength is obstructed. In spectrophotometry, the degree of extinction at a certain wavelength is therefore an indication of the concentration of a certain component (Lambert-Beer).
At one stage during my employment – I remember this was in fact at the very initial stage of micro chip manufacturing – I was tasked with controlling the quality of the incoming nitrogen. One of the tests involved the measurement of CO2 where I used an FTIR spectrophotometer, able to bombard my gas sample with radiation of 4.26 μm. As it happened, the amount of CO2 in the nitrogen was in the range of about 100 ppm. Now, like most of you, I sometimes made the mistake of forgetting….to switch off….. Never mind that, coming back the next morning I always found there was no change. I could repeat the test and still get the same result. This observation demonstrates that continuous irradiation at 4.26 μm did not produce any heating of the gas sample. Thinking back now, you can imagine that if the theory of those CO2 molecules exposed to 4.26 μm radiation continuously vibrating and turning that absorbed radiation into heat were true, it should affect all nitrogen molecules and eventually the contents of my cuvette should cook or explode… None of this has ever happened to me during any spectrophotometric measurements that I conducted…..
I also consulted ChatGPT on this and eventually he or she admitted:
‘So your experiment gives you a solid observation—CO₂ strongly attenuates 4.26 µm radiation—but the conclusions about where the absorbed energy goes, need to be tested independently’.
Let us have a look at that! Take note that CO2 also has absorptions in the near infrared region. Scientists can pick up the back-radiation of this via the dark side of the moon. Here is the report:
I show Fig. 6 (bottom) of the above-mentioned report here:
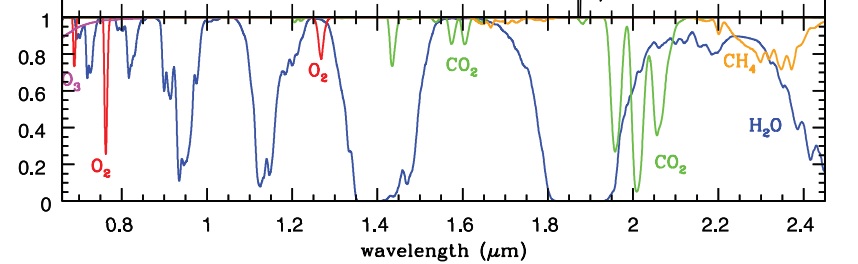
Fig. 2
Schematically, what we see is happening in Fig. 2:
Sunlight to the Earth = > absorption of radiation by CO2 (green curve, various peaks between 1.4 and 2.1 um) = > re-radiation back to the source and to space = > therefore also to the moon = >via the dark side of the moon back to the earth = > to the measuring instrument.
We have seen that exposure of greenhouse gas to radiation from the sun and from earth in certain wavelength ranges 0-25 μm cannot go through the molecule because passage through is restricted in certain areas. Whatever the cause: we conclude that in the wavelength ranges where absorption of photons has taken place, the individual gas molecule re-radiates or back-radiates. My proposed model/analogy is to compare the molecule at the absorbing wavelength with a very small spherical mirror, ‘reflecting’ the light at that wavelength. The strength of the emission depends on the size of the amount of absorption that takes place in the molecule. There has been debate about the distribution of the emission. I considered that you could compare this problem a bit with putting your headlights on in foggy conditions: most of the light is going to the source, i.e. straight back in your face.
Assuming my ‘mirror’ analogy is correct and:
- that a gas molecule is completely spherical
- that the gas molecules are turning at a certain constant speed, in whatever direction
and knowing:
3. that the surface area of half a sphere is always in a ratio of 2:1 to the surface area of a perfect circle,
it follows that, taken over 180 degrees, 66.7% of a certain amount of light, due to the irradiation of the molecule with light of the absorbing wavelength, is sent back in the direction where it came from. The rest simply just goes around. I don’t agree with the theory that it is simply 50/50. But that is my opinion.
By my account the above-mentioned process is the real so-called greenhouse effect of individual gases that have absorption in their spectra. Either way, I think that the distribution of the re-radiation being either 50/50 or 67/33 in the direction of the source most probably does not materially affect the outcome of my report.
The faulty Planck curve:
This is a point that is well known in many skeptical science circles. For official calculations, the electromagnetic radiation spectrum from earth is generally misrepresented as a ‘blackbody-type’ of distribution that starts emission at 4 μm. (e.g. see Wikipedia/ KNMI). When I investigated this matter, I went over a few issues, as related below,
- The notion that the average temperature of earth is 288 K leading to the peak of the ‘earthly’ Planck curve being around 10 μm, appears to be incorrect. For one thing, the given average of 288 K for Earth does not really include both polar regions and Greenland, due to a lack of weather stations in these areas.
- Flying across the world at an altitude of ca. 10 km, I observed that temperature outside the plane was always around -50C. According to Wien’s law, this corresponds with an outgoing radiation of ca. 13 um. That made me wonder. I considered that a reasonable average for outgoing radiation might be if you looked at it from halfway through the troposphere. Apparently, the temperature in the middle of the troposphere is 247 K, giving (me) an estimated average peak of the outgoing radiation from Earth of ca. 12 μm. That was already a nice shift of 2 μm.
- With Wien’s Law you can calculate that with outgoing radiation at 4 μm, you must have a source of heat of 725 K. The general cooling of earth over the millennia, although maybe not always on a nice downward curve – showing small upward peaks every now and then (some apparent ‘global warming’ observable at regular intervals of 1000 years – just like now – due to the Eddy cycle ) and the virtual complete dying down of continuous volcanic activity on land, brought me to thinking that there is absolutely no chance of earth emitting any radiation of a wavelength smaller than 5 μm. This point is quite critical when we observe the infrared spectrum of CO2 (Fig.1). In terms of quantum energy (expressed in eV) the energy back-radiated at 4.26 μm is about 4 times higher than that at 15 μm.
- Eventually, I figured that Earth’s outgoing radiation cannot be represented adequately by a single Planck curve at one uniform temperature. The surface of earth is not uniform like a planet such as Mars. It includes vast areas of water, snow and ice, desert, and land – both with and without vegetation. You would expect a discrete function instead of a curve. It was around this time that I came across this graph as presented in a textbook by Petty. It apparently relies on actual measurements that have been carried out. The source is indicated in the description below the graph.

Fig. 3
Fig. 3 clearly shows that the measured outgoing spectrum is not a simple 288 K blackbody curve and that the dominant terrestrial emission from Earth begins at approximately 6 μm!
Discussion and Conclusion
The range of wavelengths relevant to our investigation is from 0-25 μm. It appears that Earth continuously emits thermal radiation to space, with the spectrum shown here extending from approximately 6 to 25 μm (various intensities) for 24 hours a day (Fig.3). Our Sun constantly irradiates Earth with light of all wavelengths (various intensities) for 12 hours a day, on average. Given the combined spectrum of CO2 (Fig.1 + Fig.2), it is possible to do a line-by-line analysis, in very small portions of microns (wavelength in μm). In this way it is possible to determine whether the energy due to the back-radiation by CO2 to the Sun and space for 12 hours per day, in the range of 0-25um (=the cooling effect), is smaller than the warming effect due to the back-radiation by CO2 to Earth in the range of 6-25 μm for 24 hours per day. Given careful attention to the issues mentioned above, with no deliberate misunderstandings, e.g. ignoring the various absorptions of CO2 in the near infrared or applying the incorrect emission curve for Earth, you eventually should be able to figure out that the amount of energy back-radiated by the CO2 to Sun and space is just about the same as the energy of the back-radiation by CO2 to Earth. My own results followed by a few typical results from other independent scientists are reported below.
https://1drv.ms/x/s!At1HSpspVHO9pws8aNzcnG9n6skv?e=b6IwLG
End result (first 3 rows, columns K,L,M): -0.0063 eV per molecule; i.e. no warming effect by more CO2
End result: -0.03K for doubling of CO2 concentration: i.e. no warming effect by more CO2
End result: no warming by 100% CO2 compared to Argon and air: ‘These findings might question the fundament of the forcing laws used by the IPCC!’
https://principia-scientific.org/industry-experts-co2-worse-useless-trapping-heatdelaying-cooling-2/
End result: After exhaustive experiments Berkeley’s brightest and best reported that “the effect of the infrared radiation properties of CO2 is unnoticeable’.
Microsoft Word – SCC-Koutsoyiannis-Dog&Tail-Nov-2024.docx
“The effect of the (additional) CO2 is quantified at 0.5% for both downwelling and outgoing radiation.’ Essentially this end result can be interpreted as being zero. (I notice for the first time that the downwelling long wave radiation that is returned to the Sun and space by the CO2 has been brought in as a factor).
Interesting stuff, thank you. I particularly liked your experimental verification: “Now, like most of you, I sometimes made the mistake of forgetting….to switch off….. Never mind that, coming back the next morning I always found there was no change. I could repeat the test and still get the same result.”
Thanks for linking my paper in your post.
You may want to see also me latest paper, which explains that the atmosphere function is just the opposite to that of a greenhouse and what is called “greenhouse effect” should have better been called “anti-greenhouse effect”. (I propose using different terminology, consistent with the fact that the radiatively active gases and clouds are active also at SW radiation). You may see my paper starting from https://climath.substack.com/p/founding-climate-on-solid-groundpart .
Thanks for that comment. I will check your report tomorrow. I agree with the existence of anti-greenhouse gases. I have always figured that the net effect of more ozone in the sky is cooling rather than warming because of the strong absorption of ozone in the uv; energy wise the absorption and subsequent back radiation of 10 um is nothing compared to that back radiation of the uv.
I was at church today and I was blessed today knowing that Jesus = truth and that Jesus has already won. He destroyed all the lies. So, we have already won. It is just a matter of time. We just have to speak the Word more clearly: the science about CO2 being evil is not correct. I even put the sermon on my website now. ‘Words matter: Speak life!’ There is no negative about the truth. But I agree that we face an enemy who is relentless. To pronounce the gas that gives life as being evil, is probably similar to pronouncing a whole race as evil, like it happened in WW2. Maybe WW3 is in the making…?
Please go to the late John L. Daly’s website: “Still Waiting for Greenhouse” available at http://www.john.daly.com. From home page go to end and click on: “Station Temperature Data”. On the “World Map” click on “Australia”. There is shown at list stations. Click on “Adelaide”.
The chart shows a plot of the annual mean temperatures from 1857 to 1999. In 1857 the concentration of CO2 in dry air was ca. 280 ppmv (0.55 g CO2 per cu. m. of air), and by 1999 it had increased to ca. 368 ppmv (0.72 g CO2 per cu. m. of air), but there no corresponding increase in air temperature in this port city. Instead there was a slight cooling that began in ca. 1940. In 1857 annual mean temperature was 17.4° C and by 1999 it had declined to 16.7° C.
Th reason the increasing concentration of CO2 had no effect on air temperature in Adelaide is quite: there is too little CO2 in the air to absorb enough IR light emanating from the earth’s surface to warm up the air.
Click on the back arrow to return to the list of stations. Click on the back arrow again to return to the “World Map”. John Daly found over 200 weather stations that showed no warming up to 2002. His many temperature charts falsify claim by the IPCC that CO2 causes global warming. His charts support your work that CO2 does not cause warming of air.
I have problems reaching that site.
The correct URL for John Daly’s website is:
http://www.john-daly.com. You can now can go and check out his website. At the end of the site there are essays that would be of interest to you.
For recent Adelaide temperature data, I went to:
https://www.extremeweatherwatch.com/cities/adelaide/
average-temperature-by-year. The Thi and Tlo data from 1887 to 2025 are displayed in a table. The Tav for 2025 was 17.2° C. After 158 years there has been no warming of the air in this port city. In 2025 at the MLO the concentration of CO2 was 423 ppmv. One cubic of that air contained 0.83 grams of CO2.
At the Mauna Loa Obs. in Hawaii, the concentration of CO2 is currently 425 ppmv. One cubic meter of this air has mass of 1,290 grams and contains 0.84 g of CO2. Please note how very little CO2 there is in the air. This small amount of CO2 in such a large mass of air can have no effect on weather and climate.
In your essay you should mention that the greenhouse plays only small role in the warming of the air. The main process for warming of the air: (1) Heating of the earth’s surfaces by absorption of sunlight, (2) warming of the air by contact with the warm surfaces , and (3) warming of the atmosphere by convection of the warm air.
I live Canada which has long cold an snowy winters. In winter H2O and CO2 hibernate.
@Harold Pierce
I can confirm from my own results that temperatures in AU have been dropping and that this does not make any sense with the increasing CO2 happening there, as measured and reported by John Daly. I also found this in South-Africa:
https://breadonthewater.co.za/2021/11/25/an-inconvenient-truth/
This is clear empirical evidence that more CO2 cannot be the cause of global warming