+27 83 629-7690

A realistic view on climate change

By guest blogger .

I.4 Other consequences of CO2 concentration and temperature increase

I.4.1 Consequences of temperature increase

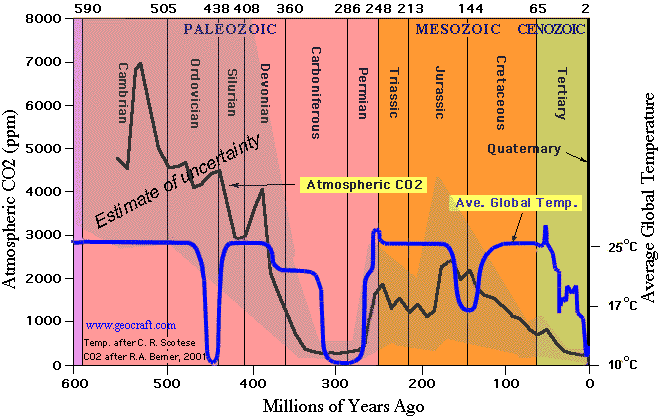
In the Netherlands, or Western Europe, it is not unusual for the difference between daily maximum and minimum temperatures to be more than 10°C. Nobody finds this strange or dangerous. But according to the media, the earth will irrevocably break down if an average of 1.5°C to 2°C is added. This seems strange because in the (distant) past, such and even higher temperatures prevailed on earth. And yet there were no tipping points…

Figure 2 : Temperature and CO2 concentration from 600 million years ago to the present Source

Late Carboniferous to Early Permian time (315 mya — 270 mya) is the only time period in the last 600 million years when both atmospheric CO 2 and temperatures were as low as they are today (Quaternary Period) . Temperature after CR Scotese http://www.scotese.com/climate.htm CO2 after RA Berner, 2001 (GEOCARB III)

For long periods, the temperature on Earth was 20 to 25°C, while now it is only about 15°C. It is now about 10°C colder than it has been for most of the time that the Earth has existed. There was also much more CO 2 in the past , 1000 to 7000 ppm. It is not surprising that the temperature is so low, because we are still living in an ice age :

“ An ice age is a period in which ice caps occur on land. The presence of ice caps on Greenland means that we are by definition living in an ice age . ”

Should one be concerned about a degree more? If one looks at the past, there is little reason to be; the normal temperature on Earth seems to be between 20°C and 25°C. This also means that there can be no tipping points below 25°C, because they have not occurred in the past. The temperature will probably return to somewhere between 20°C and 25°C, the normal temperature. There are advantages to that one degree more, by the way.

I.4.1.1 Fewer climate deaths

The climate always fluctuates, but has remained virtually unchanged since 1850. There are now only slightly milder average temperatures. But even this small average temperature increase results in fewer “climate deaths”. This is because it is mainly the minimum temperatures that are rising, so the average is also slightly higher. Many more people still die from the cold than from the heat.

From a study of deaths in England and Wales:

A.Gasparinni et al. , 2022 :

“Our analysis indicates that the excess in mortality attributable to cold was almost two orders of magnitude higher than the excess in mortality attributable to heat.”

Excess mortality due to cold temperatures was 32 times higher than from heat in Switzerland from 1969 to 2017.

de Schrijver et al., 2022 :

“Total all-cause excess mortality associated with nonoptimal temperatures was 9.19% [95% confidence interval (CI): 7.72, 10.47], which translates to 274,578 (95% CI: 230,657, 312,761) temperature-related excess deaths in Switzerland between 1969 and 2017 (Table 2; Table S4). Cold-related mortality represented a larger fraction in comparison with heat , with 8.91% (95% CI: 7.46, 10.21) vs. 0.28% (95% CI: 0.18, 0.37).”

Excess mortality due to cold was 42 times higher than for heat in China in 2019.

J. Liu et al. 2022 :

“We estimated that 593·9 (95% UI:498·8, 704·6) thousand deaths were attributable to non-optimal temperatures in China in 2019 (PAF=5·58% [4·93%, 6·28% ]), with 580·8 (485·7, 690·1) thousand cold-related deaths and 13·9 (7·7, 23·2) thousand heat-related deaths.”

Excess mortality due to cold temperatures was 12.8 higher than that due to heat “across 612 cities within 39 countries over the period 1985–2019.”

N. Mistry et al. 2022 :

“Here, we perform a comprehensive assessment of temperature-related mortality risks using ground weather stations observations and state-of-the-art reanalysis data across 612 cities within 39 countries over the period 1985–2019. … In general, across most countries, the estimates of the excess mortality are very similar, with a global-level excess of 0.53% (95% eCI 0.50–0.56) versus 0.49% (0.43–0.53) for heat, and 6.02% ( 5.80–6.18) versus 6.25% (6.05–6.41) for cold, from ground stations and ERA5-Country data, respectively (‘Global’ in Fig. 5 and Table S3). These percentages correspond to 357.729 ( 95% eCI 335.138–376.498) versus 326.032 (288.069–357.247) for heat , and 4,030.793 (3,880.068–4,137.579) versus 4,186.014 (4,051,321–4,293,311) for cold .”

Global warming reduces “climate deaths” because about 11 to 13 times more people die from cold than from heat.

I.4.1.2 Higher crop yield

Not only does the number of climate deaths decrease, but there is also a positive effect on plant growth in general. This is especially important when growing food crops.

Gardi et al., 2022 :

“The results revealed that the CO 2 -induced increase in grain number and grain yield was higher in combination with a temperature level of 21–25 °C as compared to lower levels (< 15 and 16–20 ℃ ) .”
and
“An increase in atmospheric CO 
2 generally exerts beneficial effects on plant biomass by increasing net photosynthesis by 30 to 50% and reducing photorespiration (Drake et al. 1997 ; Poorter and Navas 2003 ; Schapendonk et al. 2000 ). This has been studied for cereals including barley, wheat, rice, oat, and rye ( Conroyac et al. 1994 ; Kimball et al. 2002 ; Long et al. 2006 ).

Chen and Sun, 2024 :
“…, while the main factor that really affects China’s crop yield directly is the local air temperature change. When the 
air temperature in China is high , the yield will show an increasing trend, and vice versa.”

Figure 3 : Increase in world food production, source

The graph above, figure 3, shows that there is a continuous increase in world food production. The yield is increasing partly due to the “CO 2 fertilization”

A higher temperature therefore has beneficial effects on greening and world food production.

I.4.2 CO 2 concentration increase

I.4.2.1 Is CO2 “ dangerous”?

CO2 is not a “pollutant” or toxic substance, as some people, including the media, claim. The concentration in air exhaled by humans contains up to 40,000ppm CO2 . From https://www.cdc.gov/niosh/idlh/124389.html : “ It has been reported that submarine personnel exposed continuously at 30,000 ppm were only slightly affected, provided the oxygen content of the air was maintained at normal concentrations [ Schaefer 1951 ]. ” The “Occupational Safety and Health Administration” “Permissible Exposure Limit” (OSHA PEL) is a legal safe limit at which work is allowed and is currently 5000ppm in the US, 12x higher than the current concentration in the atmosphere.

CO 2 is the building block par excellence of all life on earth. Plants breathe in CO 2 and use it to produce all kinds of substances that are essential for their life. When there is a shortage of CO 2 , plants die. And consequently also the herbivores and eventually also the carnivores. That is why CO 2 is essential for life, also for humans.

I.4.2.2 The earth becomes greener, higher crop yields :

In an article from NASA: https://www.nasa.gov/centers-and-facilities/goddard/carbon-dioxide-fertilization-greening-earth-study-finds/
there is a short film about how the earth is becoming greener due to increased CO2 
concentration , helped by higher temperatures. It refers to a study by Zhu et al, 2016

Zhu et al., 2016 :

“ CO 2 fertilization effects explain most of the greening trends in the tropics , whereas climate change resulted in greening of the high latitudes and the Tibetan Plateau. LCC contributed most to the regional greening observed in southeast China and the eastern United States. ”

Chen and Sun, 2024 :

“Besides, CO 2 is an essential element of crop photosynthesis and a major climate change scenario construction indicator. Increasing CO 2 concentration in the Earth’s atmosphere can increase the photosynthetic rate of crops, which directly stimulates crop growth and increases the dry matter content, resulting in increased food production ( Lawlor & Mitchell, 1991 ; Wang et al., 2014b ; Ziska & Bunce , 2007 ).

May and Crok, 2024 :

“Warmer temperatures and more CO 2 will mean more food at a lower price for nearly everyone,…”

(text can also be viewed here: https://andymaypetrophysicist.com/wp-content/uploads/2024/05/Carbon-Dioxide-and-a-Warming-Climate-are-not-problems_Final_Submission_no_logo.pdf )

A higher CO2 concentration , together with a higher temperature, provides more green and more food (figure 3). This is favourable, given the increase in the world population.

I.4.2.3 Other effects of higher CO2 concentration

I.4.2.3.1 Better water management

Song et al., 2024 :

“ The CO2 fertilization effect has benefits for both vegetation growth and water use efficiency (WUE).”
and
“…elevated CO 
2 concentrations could indirectly enhance water availability by improving [water use efficiency]… reducing vegetation water demand .”
and
“The relationship between vegetation growth and water availability (referred to as Rvw), representing vegetation responses to water availability, is a key metric for understanding 
vegetation responses to drought under climate change ( Shi et al 2021 , Zhao et al 2021b , Chen et al 2022 , Smith and Boers 2023 ). Over the past few decades, global vegetation growth has been observed to increase, a phenomenon known as ‘greening’ ( Myneni et al 1997 , Zhu et al 2016 , Huang et al 2018 , Piao et al 2020 ). The vegetation greening trend, attributed to factors such as the carbon dioxide (CO 2 ) fertilization effect, climate warming, and human activities, has been widely studied ( Piao et al 2015 , 2020 , Lu et al 2016 , Zhu et al 2016 )”
and
“The 
CO2 fertilization effect has benefits for both vegetation growth and water use efficiency (WUE) ( Lu et al 2016 , Humphrey et al 2018 , Wang et al 2020 , Hsu and Dirmeyer 2023 )

I.4.2.3.2 Cooling or less warming

J. Wu et al. 2023 :

“ Our findings illuminate Earth greening’s potential to mitigate hot temperature extremes , offering a pathway toward more resilient and sustainable climate adaptation and mitigation. ”

Li et al., 2023 :

“According to satellite observations, the earth has been experiencing widespread vegetation greening since the 1980s, primarily due to large-scale climate change and CO 2 fertilization effects 1,2 . Such greening could mitigate global warming by triggering negative biochemical feedback to the climate system, which refers to increasing CO2 removal from the atmosphere through the vegetation photosynthesis process 3–5 .”
and
“ 
Vegetation greening in dry and warm regions significantly cools the land surface ,
and this cooling diminishes and reverses to the warming effect with gradually decreased temperature or increased precipitation (Fig. 1b).”

Y. Cao, 2023 :

“ Here, we provide the first observational evidence of the greening effects on SAT and SAT extremes in China during 2001–2018 using the ‘space-for-time’ method. The results show a negative SAT sensitivity to greening (–0.35 °C m 2 m –2 ) over China and a cooling effect of −0.08 °C on SAT driven by vegetation greening during the study period. Such a cooling effect is stronger on high SAT extremes, particularly over arid/semiarid areas, where greening could bring an additional cooling of −0.04 °C on the hottest days. An attribution analysis suggests that the main driving factor for the cooling effect of greening is the evapotranspiration change for arid/semiarid regions and the aerodynamic resistance change for humid regions. ” (SAT = near-surface air temperature)

Summary

The earth is becoming greener and the cause of this is an increase in the CO 2 concentration and the temperature. This greening has a favourable effect on the temperature and results in less warming or even cooling. Partly due to the improved water management of all plants, there is a favourable effect on evapotranspiration. This reduces the risk of droughts.

Check: Claim (5) “It is assumed that an increase in those two, temperature and CO2 concentration , would be harmful(5).” is completely wrong. There are almost only beneficial effects associated with both the increase in CO2 concentration and the increase in temperature. One may wonder why governments want to take “climate measures”? After all, there is nothing wrong with the climate. One could even claim the opposite.

***

To be continued.

Please share this post
Christmas 2024

Christmas 2024

It is the end of the year and as is customary I would like to say a few words of thanks to all our donors, supporters and beneficiaries. We look back at 2024 and note: God is good! Thanks to  all of you Heart for Children  collected just over R200000 to provide gas stoves to all homes of the Rehoboth Children’s village near Port Shepstone plus complete solar power for the education-, distribution- and activity center, respectively. This will make them less dependent on power from ESKOM so that most activities can carry on if there is a power outage. We have also been able to carry on with our regular support of the children’s homes that we are committed to. Many thanks to all of you who contributed this year to achieve these fabulous results. I know times are still quite tough, but we know that the King is with us, in us. It is Christmas!!

Proposal for a new project for 2025

Our financial director, Philip Nicholson, has recently joined the board of the “Guardians of Hope” (GoH), an organization that facilitates rescue and assistance in East London to a maximum of ca. 30 babies and small children. Instead of providing for daily necessities as was originally intended (for which we have already received ca. R2500 – many thanks to you!!! ), Heart for Children has now been asked by GoH to provide for a canvas roof for a certain area near the home. The cost is R59000. We think that this is a good project. If you have not yet done so, please take a few minutes to watch this video of GoH:

https://youtu.be/Kr5W3muo57c

For more information, you can also go to the GoH website: Guardians of Hope | Place of safety Will you help us again? We decided to extend this special fundraising effort during 2025 for as long as is necessary to reach the target. (Together with your donation, please use your name and the word ‘hope’ in the reference).

Thanks to some of you – especially Christine in Empangeni, – thank you so much!!! – we are still able to keep the ministry of Crystal Cathedral Ministries SA / Bread On The Water on the internet. Don’t miss the sermons by Tony Campolo and Kenneth Ulmer, respectively, click here: CCMSA | Bread on the water

As you know, I am a bit of a blogger and I will continue to expose the false religion of the green faith, click here: The Green Faith | Bread on the water

Most recently I wrote something interesting about the ozone layer and how to protect your skin against cancer, click here: The hole in the ozone | Bread on the water

Did you get the internet link to the CD with carols that we sent to you by SMS? Just listen to it on your device with your headphones on. Be blessed by listening to these holy songs again! Click here: It is time for Christmas carols! | Heart for Children

We wish you a wonderful Christmas and a very blessed New Year!

If you must travel, please drive carefully, and, whilst driving, forget about your phone! May God bless you richly,

Henry and Annette Pool

0836297690, henrypool7@gmail.com

Henry’s Blog | Bread on the water

0834696875, annette.pool@gmail.com

NEWS | Heart for Children

To make a donation, click here: https://breadonthewater.co.za/donate/


The hole in the ozone

The hole in the ozone

I had to laugh a bit, when I read the above article again, written by me in 1989. The way I remember things is that I did most of the work and that Siemens Germany was eager to follow my lead because of the tremendous savings in the use of solvents. Never mind all that, the article does give a bit of a background to the ozone ‘problem’. What I am interested in now is finding out if there ever was a problem with our ozone layer and if our health could be in danger because of it. Let us have a look at some data.

The oldest data we have for ozone come from Arosa, Switzerland:

Source here:  Ozone measurements – MeteoSwiss

We notice a drop from about 330 to 315 DU between 1970 and 2015, on average.  This is about 5%. First, understand what we are measuring, exactly. To convert Dobson Units to parts per million (ppm), scientists use a conversion factor of 2.69 DU that equals to 0.001 ppm. This means that we are measuring 330/2.69 x 0.001 = 0.12 ppm. This is 0.000012 % v/v. It is an extremely small amount and obviously that affects the accuracy of our measurements. In real terms that 5% difference translates to only 0.006 ppm. Our source does not mention the possible error in their measurements but I think that with 0.006 ppm ozone we are reaching the limit of what is possible for us to measure. It is also reported by our source that there were changes in method and machine over time. I had a look at the original data from Arosa myself and was able to present a polynomial with a correlation coefficient of 0.5 showing a bending point, revealing an upward trend. See graph below. This suggests the possibility of a sine wave curve which would mean that the 5% drop could be wholly or at least partially due to natural phenomena happening over time on the top of our atmosphere (TOA).

How big are the holes at the poles? Here are the satellite data:

Source: 20 Questions and Answers | Ozone Secretariat   (Question 11)

Our attention is drawn to the broken line in the middle which apparently represents the average that was measured before the introduction of the satellite measurements, namely 1970-1982. I think these measurements were few and far in between and confined to just a few places, so I wonder how this could possibly be made representative of the whole area between the specified latitudes of the Arctic- and Antarctic. Anyway, the thing that strikes me most is that there is no trend upwards, from anytime, as is the case with the Arosa data. The ‘holes’ simply go on and on and on….I certainly don’t understand why our source is claiming that our ozone ‘problem’ has been resolved and that the ‘holes’ will disappear in a few decades. See: https://youtu.be/05HS141u4yA (The clip is only 2 minutes)

I would now like to introduce a report which caught my attention quite some time ago:

https://eodg.atm.ox.ac.uk/eodg/papers/2005Papendrea1.pdf

I should first explain again that NOx, Ozone (O3) and Hydrogen Peroxide (H2O2) are all made naturally TOA from the gases nitrogen, oxygen and water (vapor), respectively. The reactions are initiated by the varying amount of the most energetic particles (radiation of the shortest wavelengths) that we get from the sun. For some reason Papendrea et al were interested in measuring Hydrogen Peroxide TOA. They came to a most interesting conclusion:

‘Our data show a peak in H2O2 in the equatorial stratosphere and large values in the Antarctic ozone hole region. We also find some night – day variations in the H2O2 concentrations. Our retrieved profiles are in reasonable agreement with expected photochemical behavior and with a previous balloon profile.’

One would expect the peak of H2O2 around the equator as here most of the evaporation of water on earth is taking place. The presence of more water vapor at high altitudes above the Antarctic is somewhat puzzling. Perhaps it is due to ongoing volcanic activity, or, more likely, a particular wind with moist air is drawn up high by the Antarctic cold. Warm air always rises. Either way, in my opinion, the reaction initiated by the sun’s most dangerous rays to form Hydrogen Peroxide from water vapor (OH radicals) would take preference to that of Ozone from Oxygen. That is my explanation for the ‘ongoing hole’ in the Ozone layer above Antarctica.

So, what about our health, now?

After looking at the whole absorption spectrum of Hydrogen Peroxide, I was astonished to find how similar it is to that of Ozone. In terms of protection against dangerous rays from the sun, H2O2 does exactly the same thing as what Ozone does……

As we all know, Australia has the highest incidence of skin cancer. I therefore want to close off with a few quotes from the report: 

https://pursuit.unimelb.edu.au/articles/the-hole-in-the-ozone (University of Melbourne).

“So, if the ozone hole is still there, that’s why we still need to be sunsmart, right? Wrong. It’s a very common misconception, but in fact the ozone hole does not extend over Australia. Ozone depleting substances have resulted in a thinning of ozone above Australia of about five per cent, whereas over Antarctica in spring almost complete loss of ozone is seen in some layers. So the problem of the ozone and skin cancer remains regardless of when the ozone hole eventually recovers. The skin cancer problem is due to the high natural UV concentrations that occur in the southern hemisphere, especially close to the tropics. This is because the atmosphere is cleaner (less pollution from industry and less dust from land masses) and the southern hemisphere gets more radiation than the northern hemisphere because the Earth is closer to the sun in January than July.

But probably the biggest problem is that, for many Australians, we have inherited the genes of our northern hemisphere ancestors and don’t possess natural protection in our skin. The English skin, for example, has evolved 50 degrees north of the equator, where solar exposure is much less than even southern Tasmania. Plus, in the 1960s there was a change in social attitudes towards exposure to sun and the stigma of being tanned changed from being a sign of the working class (many hours logged out of doors) to being wealthy (lots of free time to go on holidays to the beach). Some years later it turned out getting a tan was a bad idea as the rates of melanoma started to rocket upwards.”

Best is to continue to cover up your skin to protect yourself against the sun’s harmful rays that still do come through the atmosphere. Use your hat!

Henry Pool

Let us make CO2 great again!

Let us make CO2 great again!

As the love affair with so-called green energy cools and “net zero” commitments to eliminate “carbon emissions” wane, so we see glimmers of acknowledgment for the benefits of more carbon dioxide. That’s right: More people are beginning to understand that the gas – widely demonized as a pollutant endangering Earth with excessive heat – is a life-giving substance needed in greater amounts.

U.S. voters know that President-elect Donald Trump has declared the Green New Deal a “scam” and promises to return common sense to environmental regulations and energy development. His return to office rests partly on that pledge.

In Europe, German politicians whose green fetish has produced economic decline face serious electoral challenges. And developing countries like India ignore “decarbonization” promises to aggressively develop coal mines and import more of the fuel to spur growth and eradicate poverty.

Less frequently reported is the story of carbon dioxide emissions greening the Earth and boosting crop production. Educating the public on the benefits of carbon dioxide is the mission of the CO2 Coalition, which I lead. We sponsor speakers and publish scientifically based materials for adults and children. Much of the information is about the role of CO2 as a beneficial greenhouse gas in moderating the extremes between daytime and nighttime temperatures and as a photosynthetic plant food.

“Fossil Fuels Are the Greenest Energy Sources” by Dr. Indur Goklany is an example of our work. Did you know that up to 50% of the globe has experienced an increase in vegetation and that 70% of the greening is attributed to plant fertilization by carbon dioxide emissions from fossil fuels? Or that nearly 200,000 square kilometers of the southern Sahara have been converted to a lush grassland from desert?

Few have heard that doubling atmospheric CO2 from its current concentration of 420 ppm would significantly increase agricultural productivity and have little effect on the climate. It appears that some of this knowledge has reached Canada because Alberta’s ruling Unified Conservative Party (UCP) recently approved a resolution that promotes the salutary effects of CO2 and endorses an outright rejection of the national government’s net zero policy.

“It is estimated that (atmospheric) CO2 levels need to be above 150 ppm (parts per million) to ensure the survival of plant life,” says the proposal for a resolution eventually adopted by the party. “The Earth needs more CO2 to support life and to increase plant yields, both of which will contribute to the health and prosperity of all Albertans.”

The UCP calls for abandoning CO2’sdesignation as a pollutant and for recognizing the gas as “a foundational nutrient for all life on Earth.” The UCP’s action was not well received by the likes of DeSmog, an online platform of climate alarmists, which called the party’s resolution “a brazen display of climate science denial that harkens back to the 1990s fossil fuel industry playbook.”

DeSmog reported that the UCP had credited the “notorious” CO2 Coalition as its source of information – much to our gratification, Except for the politically connected in the climate industrial complex, the carbon footprint phobia of recent years is a threat to everybody’s economic wellbeing. But it is a direct assault on a place like Alberta.

Perhaps second only to the Canadian Rockies, the most distinguishing natural resource of the western province is its huge deposit of oil sands – the world’s fourth largest proven reserve of “black gold.” Employing nearly 140,000 people and generating $17 billion in royalties, the oil industry is valued by Albertans.

“The problem is net zero has become a shorthand for ‘leave it in the ground,’” says Alberta Premier Danielle Smith. She plans to fight “the federal government and a coalition of extreme environmentalists who want to stop the production of oil and gas altogether.”

It is a good day when we find ourselves on the side of people fighting for the freedom to prosper as they contribute to the atmospheric store of carbon dioxide that enriches ecosystems and engenders life. To paraphrase Donald Trump: Let’s make CO2 great again.

Gregory Wrightstone is a geologist and executive director of the CO2 coalition, see  https://co2coalition.org/

 and author of “Inconvenient Facts: The Science That Al Gore Doesn’t Want You to Know” and “A Very Convenient Warming: How modest warming and more CO2 are benefiting humanity.

The Great Global Warming Swindle

Take an hour or so to find out why we are being swindled for ‘climate research’ and how people living in Africa are having to suffer without gas and oil for electricity.

Or take 15 minutes to watch how the media in the past have alarmed the world with hoaxes about changing weather.